Corrosion data analysis is fundamentally about capturing minute thickness variations. In this post, we cover the results of a comprehensive comparison of Corrosion Map analysis performance between DEEPSOUND’s dedicated analysis software, DSViewer, and third-party analysis programs.
Analysis Software Overview
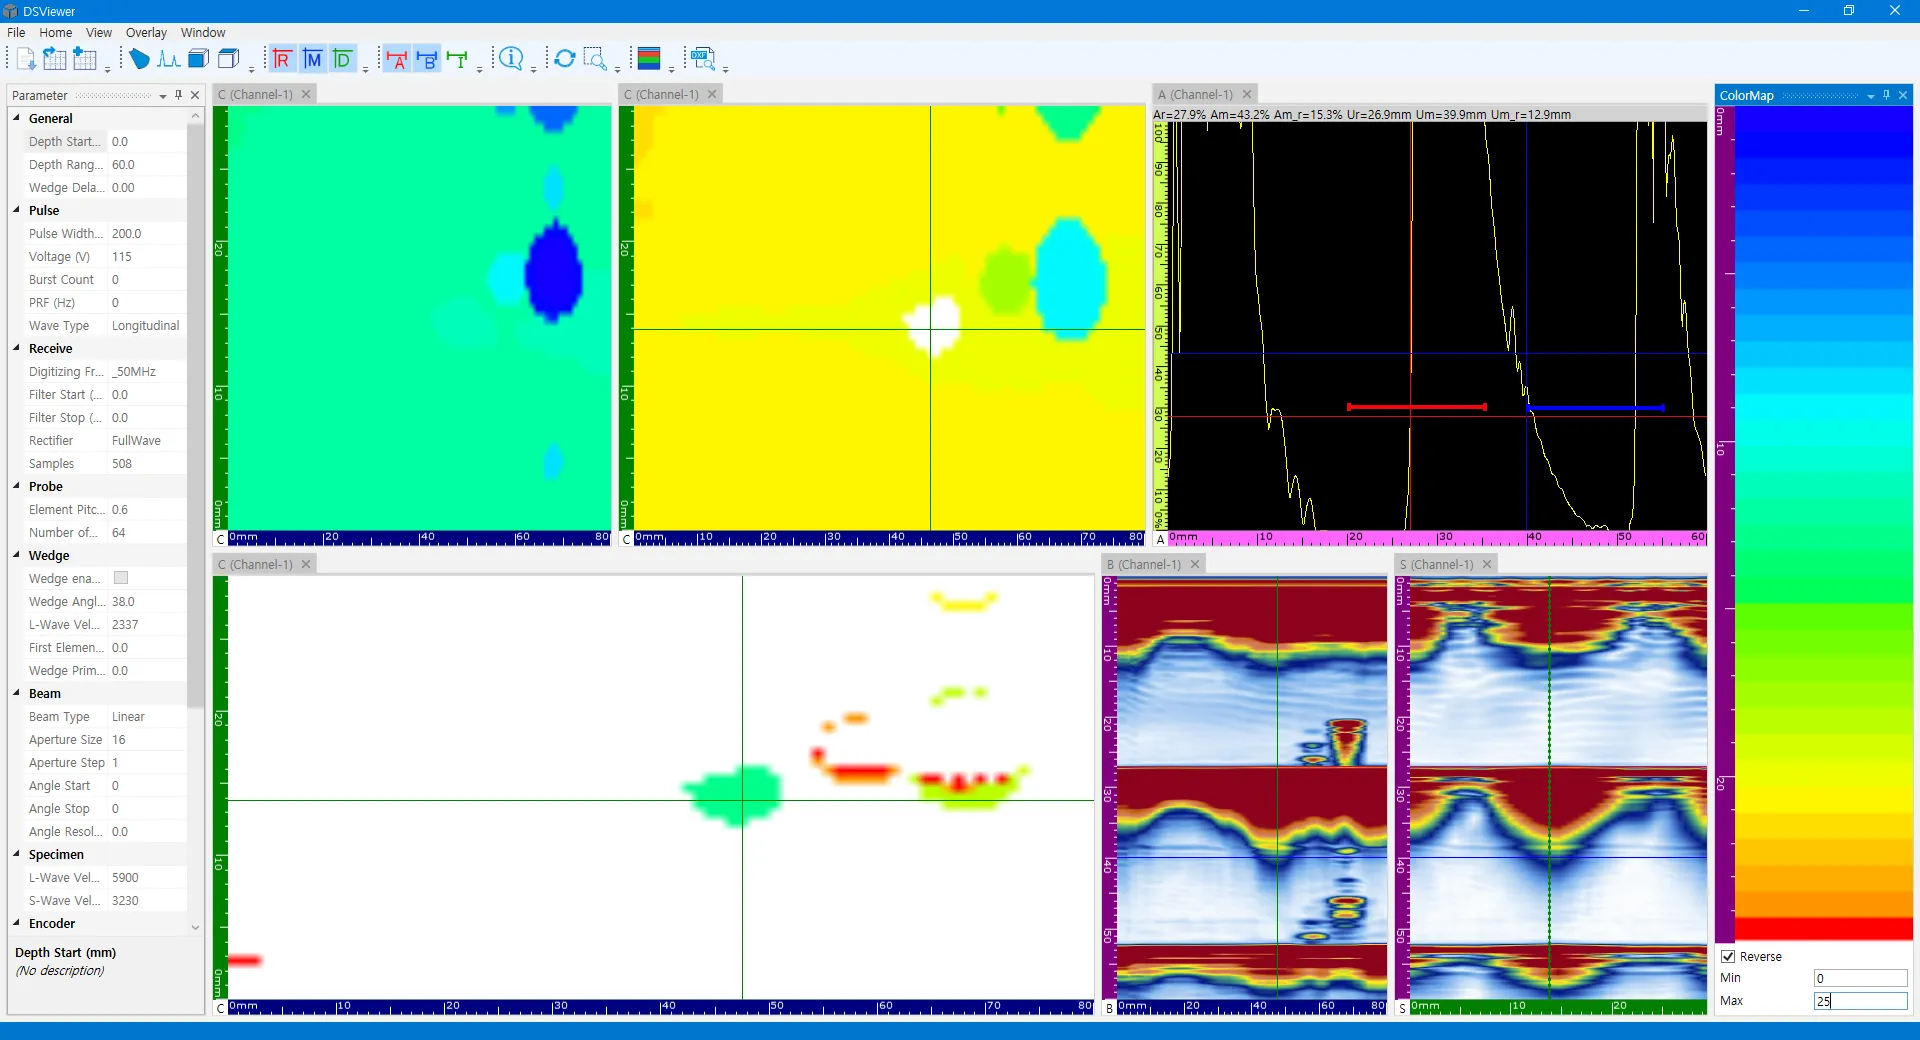
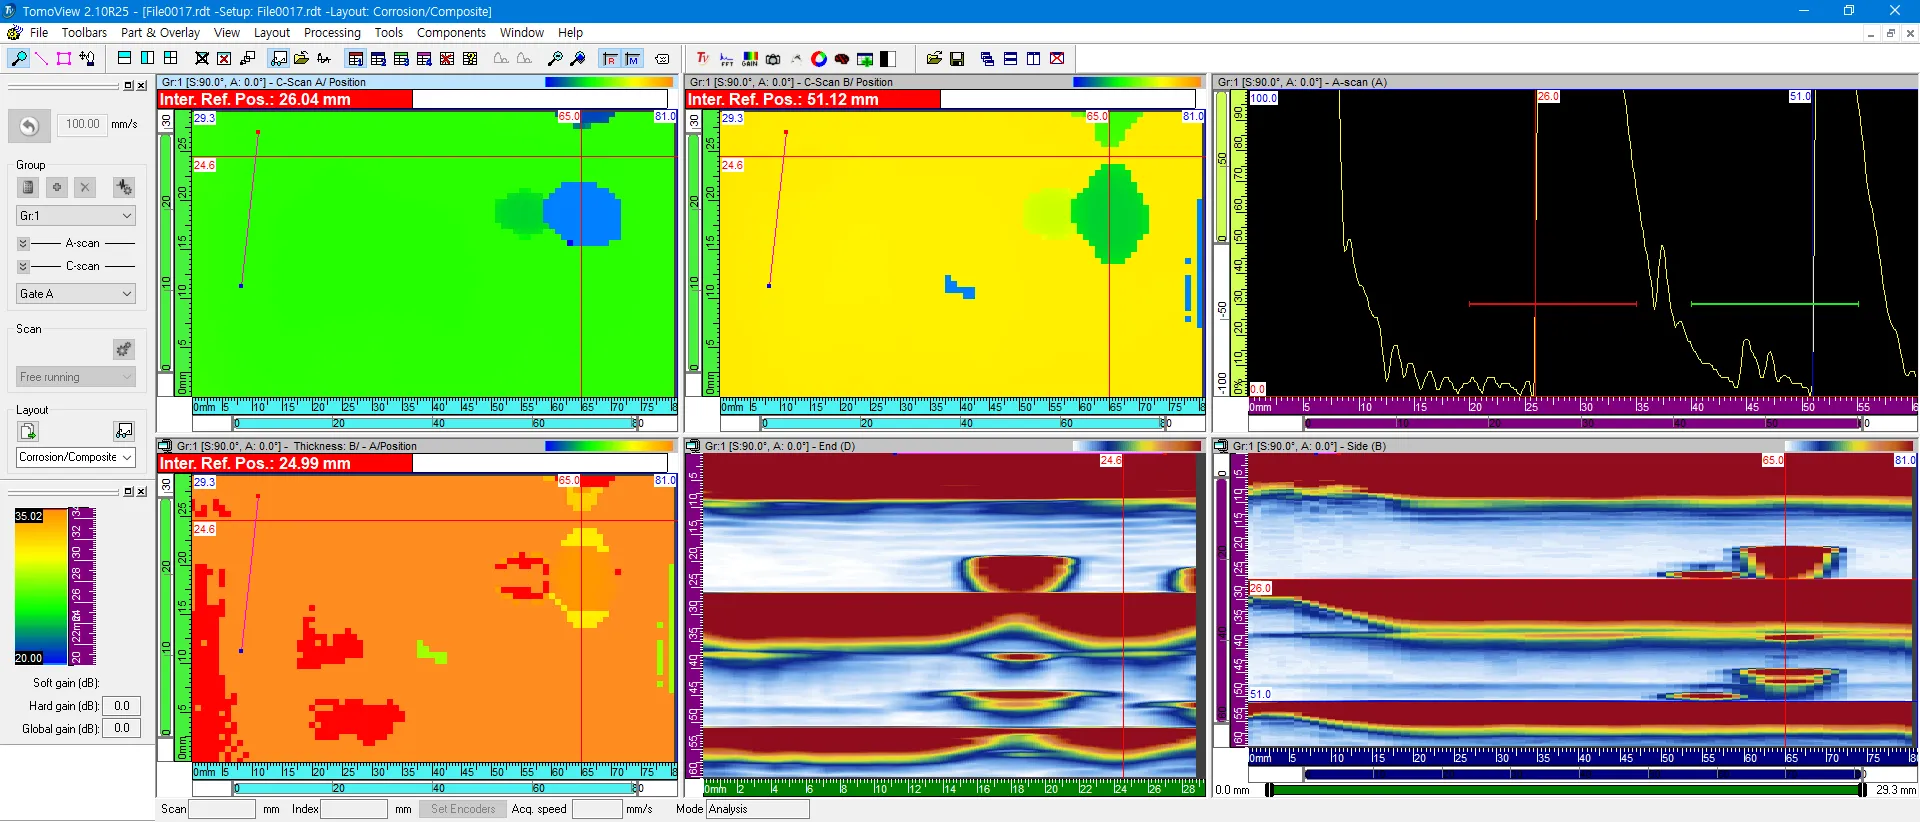
Colormap and interface configurations of both programs.
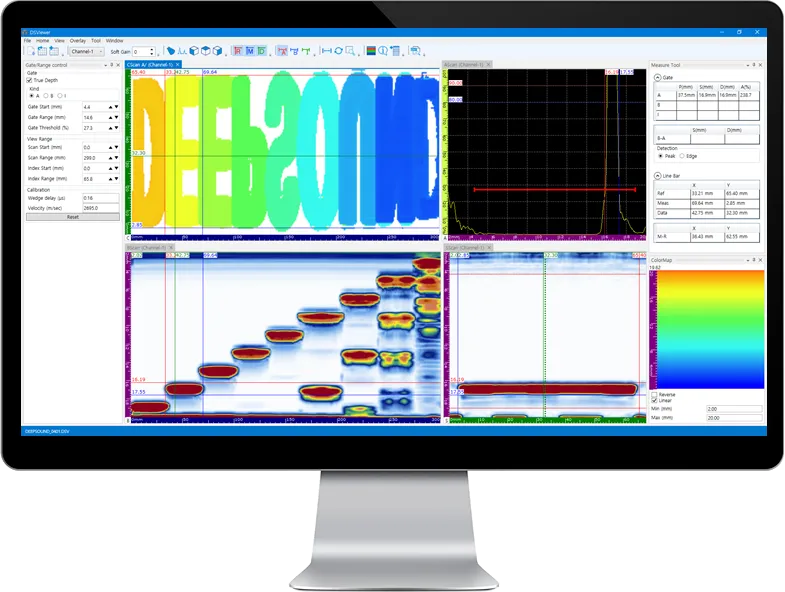
- DSViewer (DEEPSOUND)
- Third-party Analysis Program
Data Analysis Comparison #1: Initial Defect Identification
Comparison of initial defect capturing capabilities immediately after data loading.
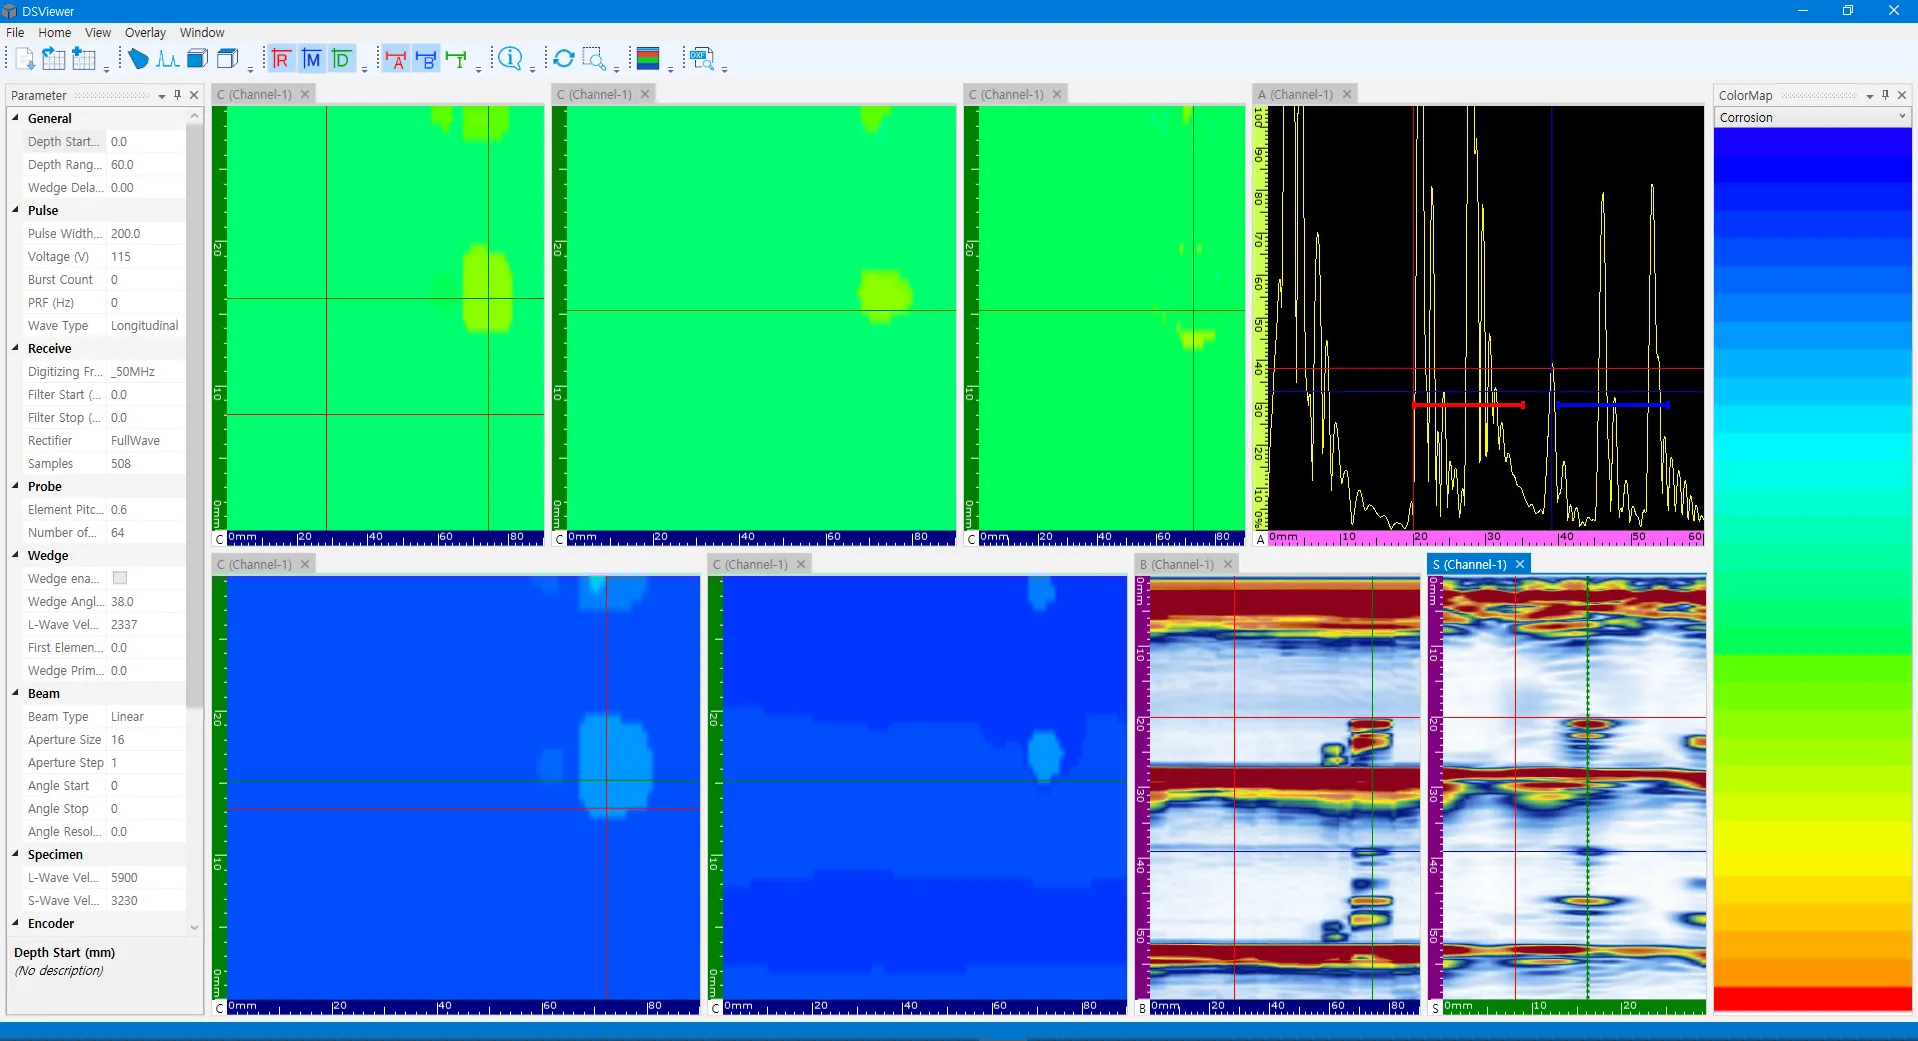
- DSViewer Interface: A-scan signals can be clearly observed and positions identified by adjusting the cursor.
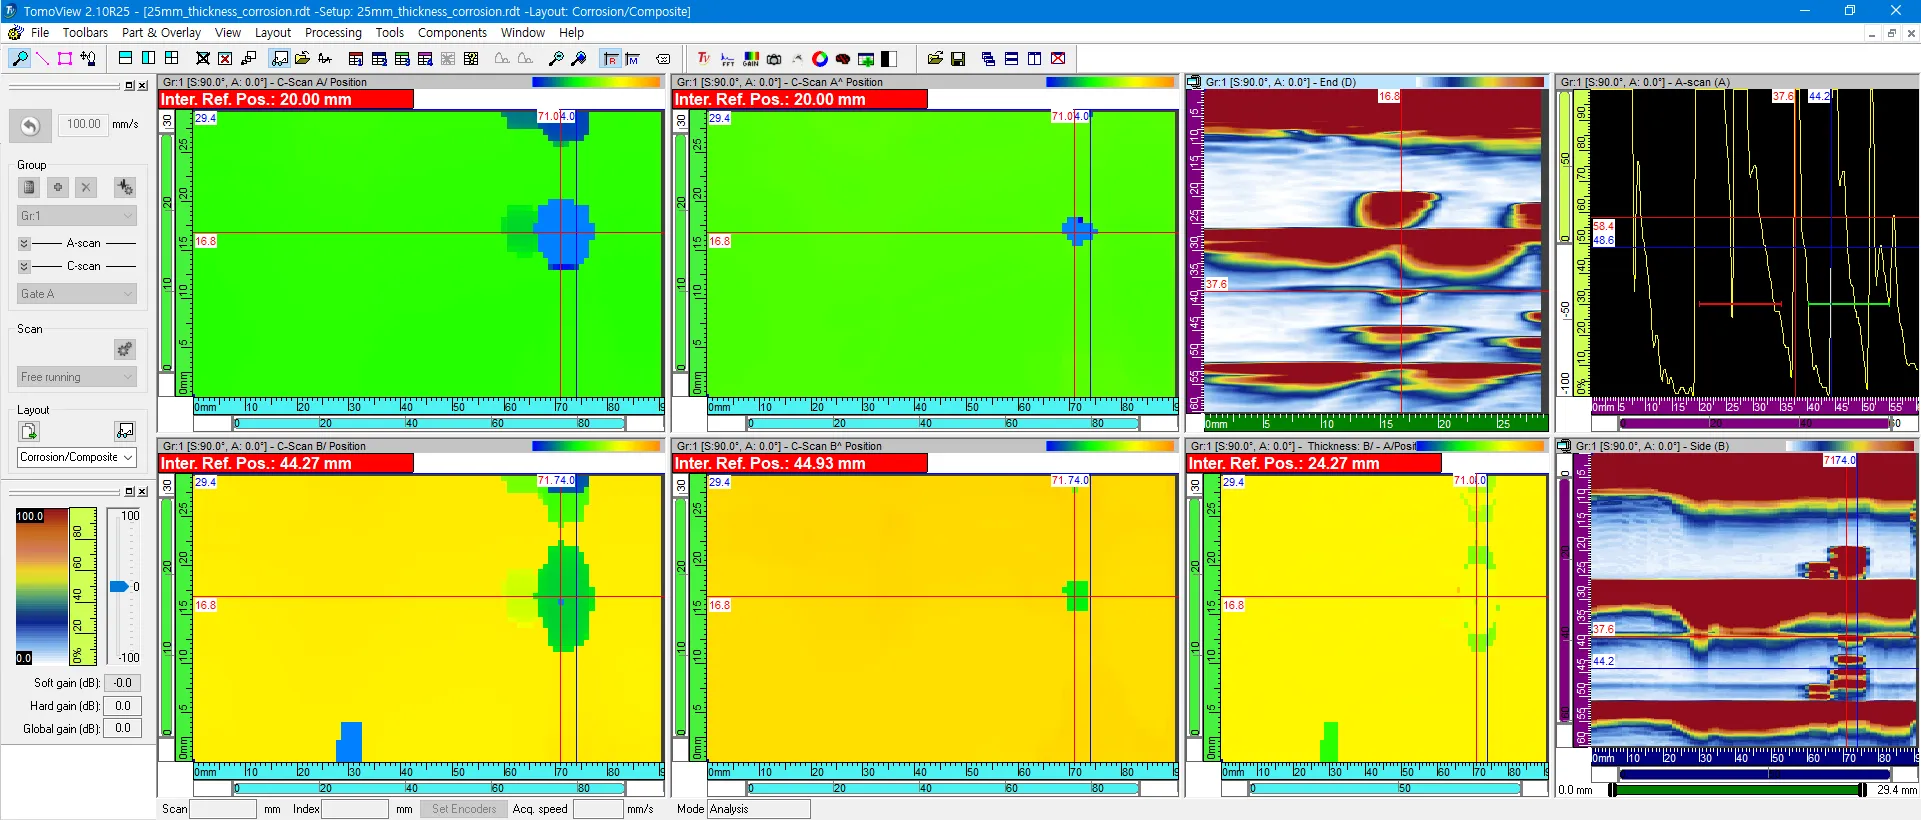
- Third-party Interface
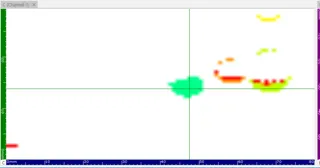
Data Analysis Comparison #2: Signal Clarity
Comparison of defect boundary detection and signal clarity.
- DSViewer Interface

- Third-party Interface
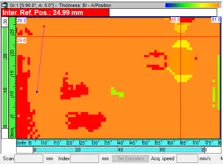
Data Analysis Comparison #3: Local Corrosion Analysis
Results of investigating local corrosion status at specific points.
- DSViewer Analysis View
- Third-party Analysis View
Conclusion & Insights
- Color Modulation: DSViewer provides intuitive visualization by very accurately adjusting color displays according to thickness changes.
- Gate Consistency: Analysis results according to A and B gate settings are very similar to third-party systems, proving data reliability.
- Analysis Precision: When comparing B-A values of specific data (Data #4), minute differences were observed between the two programs, showing that DSViewer’s sensitivity processing method is very detailed.
DSViewer is a powerful tool optimized for precisely analyzing massive amounts of data collected in the field and generating reports from the office.