DSViewer Software Manual
- Software Version: v3.0.5
- Manual Version: v1.0
- Release Date: 2026-04-21
- Last Updated: 2026-04-21
- Author: SEONGSANLAB Co., Ltd.
Getting Started Guide
If this user manual is distributed with software containing an End User License Agreement (EULA), this manual and the software described herein are provided under license and may be used or copied only in accordance with the terms of such license. Except as permitted by such license, no part of this guide may be reproduced, stored in a retrieval system, or transmitted in any form or by any means (electronic, mechanical, recording, etc.) without the prior written permission of SEONGSANLAB Co., Ltd. The contents of this manual are protected by copyright law even if not distributed with software containing an EULA.
The contents of this guide are provided for informational purposes only and are subject to change without notice and should not be construed as a commitment by SEONGSANLAB Co., Ltd. Remember that existing illustrations or images intended for inclusion in your projects may be protected by copyright law. Permission must be obtained from the copyright owner. Mentions of company names, company logos, and user names in sample materials or example forms included in this manual and software are for practical use only and do not represent actual organizations or individuals. DEEPSOUND is a registered trademark of SEONGSANLAB Co., Ltd. in the Republic of Korea and is the property of the owner.
PART I: Analysis
1. Program Overview
DSViewer
DSViewer by SEONGSANLAB Co., Ltd. is a program for loading and measuring full scanning images of objects acquired using ultrasonic equipment.
DSViewer is suitable for the following purposes:
- Loading scanned images and verifying various Scan windows such as A / S / C / B / D to measure defects.
- Permanently storing collected data and utilizing Print and Report functions for easier documentation.
2. Accessories
This section describes the accessories that can be used with DSViewer.
This program is provided without a separate license. It can be installed and used via the provided USB.
| Product | Description |
|---|---|
| Installer Program | Easy-to-use installation program |
PART II: DSViewer Software
According to current state-of-the-art technology, software is not entirely free of errors. Before using software-controlled test equipment, verify that required functions work perfectly in the intended combination. If users have questions regarding the use of equipment and software, please contact us via E-mail.
This program is designed for data analysis using DSViewer.
Important Software Notes
Before using DSViewer, finally verify that the program is installed in the correct folder path location.
Operator Prerequisites
Operating ultrasonic testing equipment requires appropriate knowledge of ultrasonic testing methods.
- Non-Destructive Testing (NDT) methods
- Operation of NDT equipment
- Defect detection criteria and methods
Lack of such knowledge may result in false test results leading to undesirable consequences.
3. DSViewer Software Functions
This section describes the general functions of the DSViewer software user interface.
3.1 Installer Program
The following information is provided to assist with program installation.
Configuring Environment
The provided USB contains the following programs. Please refer to the installation method to proceed.
List of required programs before installing DSViewer:
- .Net Framework 8.0
- windowsdesktop-runtime-8.0.8-win-x64.exe
- DSViewer
- Latest updated program.exe
3.1.1 .Net 8.0
An important program required before installing DSViewer.
- Installation program: windowsdesktop-runtime-8.0.8-win-x64.exe
- Installation order:
Run the provided windowsdesktop-runtime-8.0.8-win-x64.exe program to proceed with installation.
3.1.2 Installing DSViewer
Run the provided DSVision program to proceed with installation.

Figure: Installer Program
Proceed with installation on the desired drive.
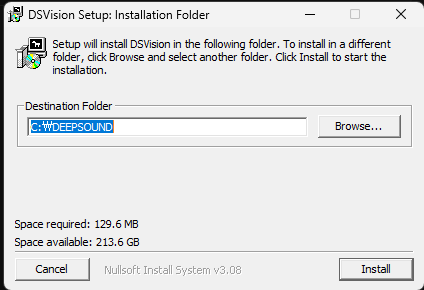
Figure: Install Window
After installation on the desired drive, a new folder named DEEPSOUND will be created. Inside, you can find the program along with the DSVision folder.
Program Location: DEEPSOUND\DSVision\Bin\Release > DSViewer.exe
3.2 User Interface and functions
You can see DSViewer configured around various functions and a convenient Toolbar.
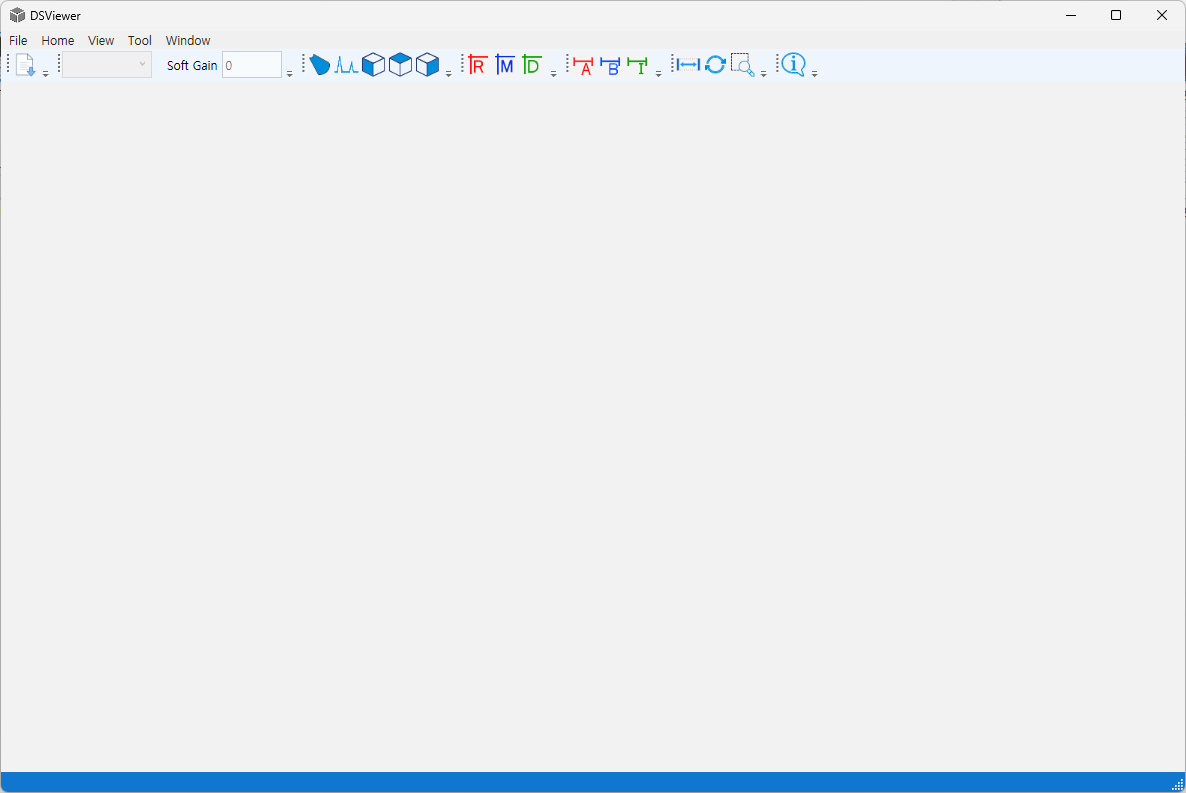
Figure: Initial screen upon program launch
4. Menu explanations
4.1 Main Window
The following section displays toolbars containing software functions. The main window includes the following items:
Collected data can be loaded to activate images and measure or verify the size and shape of defects.
Each of the following toolbars has its own characteristics:
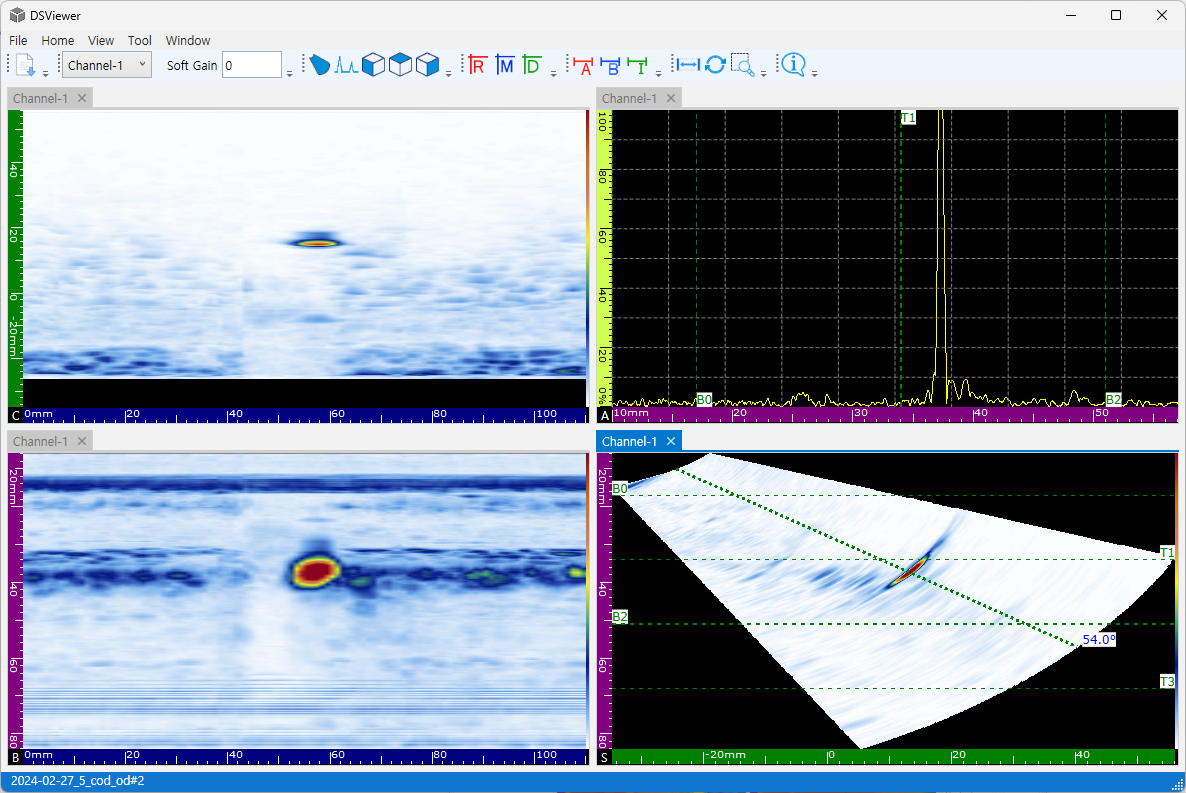
Figure: Overall program screen configuration
- Total Toolbar
- This toolbar consists of File / Home / View / Tool / Window menus when the program runs, allowing use of screen toolbars and functions.
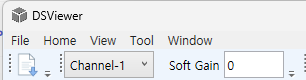
Figure: Total Menu
- Main Toolbar
- This toolbar consists of the most frequently used functions from the Total Menu.

Figure: Main Toolbar
- Sub Toolbar
- Refers to windows that appear when clicking Information and Parameter.
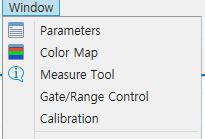
Figure: Sub Toolbar
- Mini Toolbar
- This toolbar allows you to check information being displayed at the bottom at a glance.

Figure: Mini Toolbar
- Scan Display
- The overall Scan screen consists of A / S / C / B / D views.
- The screen can be freely adjusted, and users can change to a preferred layout.
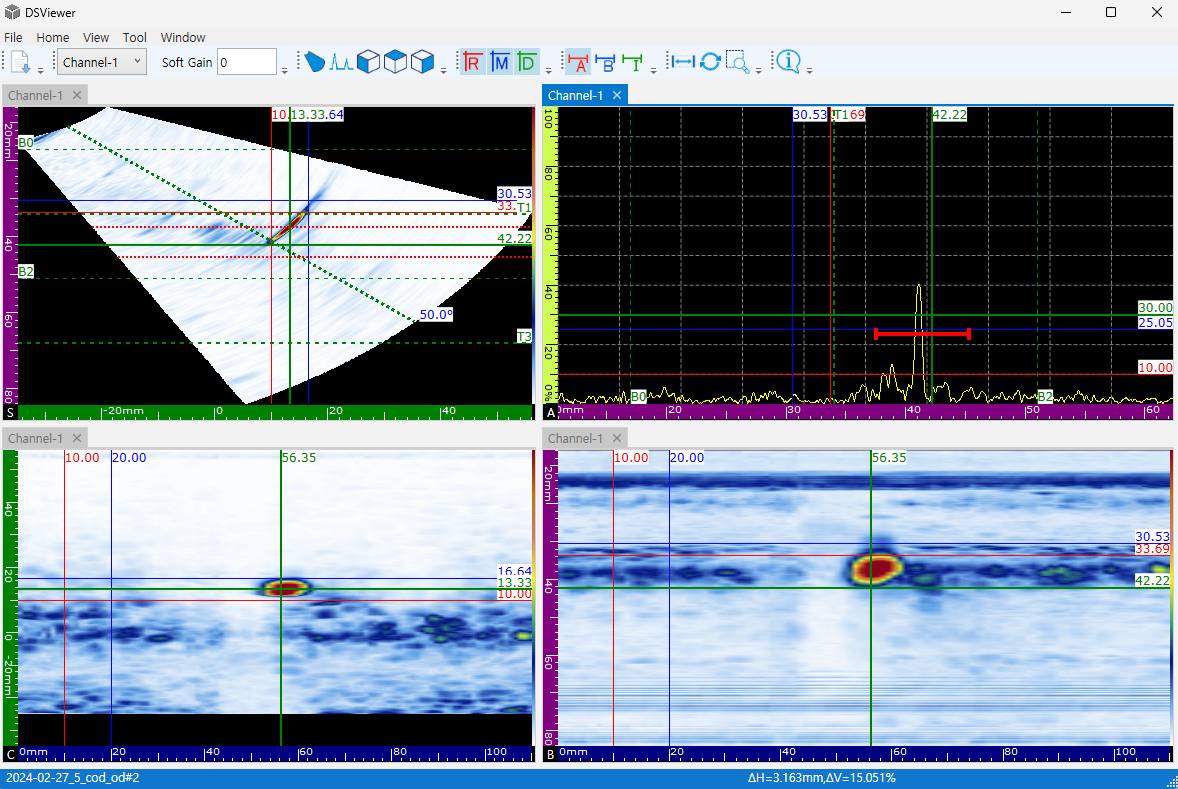
Figure: Scan Display
4.2 Total Toolbar Menu

Figure: Total Toolbar Menu
The Total Toolbar Menu consists of File / Home / View / Tool / Window. Descriptions of screen toolbars and functions are as follows:
4.2.1 Total Menu: File
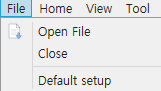
Figure: File List
The File list allows loading collected data and saving configurations modified after data analysis.
- Open File: Loads data.
- Close: Closes open data.
4.2.2 Total Menu: Home
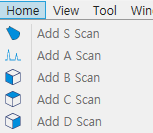
Figure: Home List
The Home list is a function to bring desired Scan windows onto the display.
- Clicking a desired Scan window automatically applies it to the layout.
4.2.3 Total Menu: View
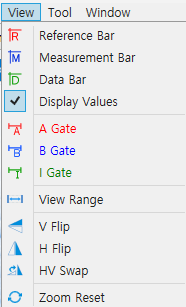
Figure: View List
The View list provides functions required during measurement.
-
Reference / Measurement / Data Bar / Display Values / Gate / View Range / Flip / Zoom Reset are immediately applied to data images.
-
Reference / Measurement Bar: These two bars are reference lines useful for measuring defect size and A-scan waveform size.
-
Data Bar: The Data bar is a reference line providing the function to check images acquired per probe position.
-
Display Values: A function to activate the current position of the bars.
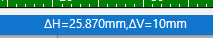
Figure: Before applying Display Values Figure: After applying Display Values
-
Gate: Gates assist in measuring position and height values for A-scan waveforms. A total of 3 gates are supported: A / B / I.
-
View Range: A function to set the position you want to see within the total collected image.
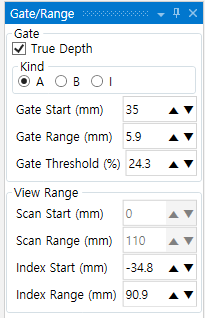
Figure: View Range Active State
When View Range is activated, it applies to two Scan windows (DScan / BScan). Line Bars for changing position are created in the Scan windows, allowing users to set desired positions and exclude other images.
✓ If precise View Range Control is needed, Gate / Range Control can be activated and used.
-
Flip: A function used when applying Flip to Scan windows, providing V / H / H-V options.
-
Zoom Reset: Zoom Reset is used to restore zoomed images to their original state.
4.2.4 Total Toolbar: Tool
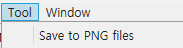
Figure: Tool List
Tool is a list used to support simple functions.
Save to PNG files: A function to capture PNG files based on the clicked Scan screen.
- Saved separately per Scan.
- Save folder location: C:\DEEPSOUND\DSVision\Bin\RES\User\Image
4.2.5 Total Toolbar: Window
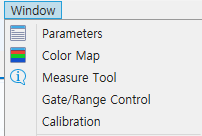
Figure: Window List
The Window list is a function that displays values for positions and forms of functions being used during measurement to the user.
- Parameter: A function to view setting values of collected data.
- Color Map: Allows checking the Color Map used for collected data and provides precise color control for Corrosion.
- Measure Tool: An information window showing values per position of Gate/Bar/laser.
- Gate/Range Control: An information window created for detailed control of Gate / View Range.
- Calibration: A window supporting Calibration.
- About… A function to check the current program version.
4.3 Main Toolbar

Figure: Main Toolbar List
The Main Toolbar consists of items that can be easily used directly from the Total Menu.
Functions are applied identically, and active items are identified by blue borders.
4.3.1 Main Toolbar: File
Click File to load collected data measured in the window.

Figure: File List
4.3.2 Main Toolbar: Multichannel View
Collected data acquired with MultiChannel settings can be verified in the Channel-1 list consisting of multiple channels.

Figure: Multichannel View List
4.3.3 Main Toolbar: Soft Gain
Amplitude values of collected data acquired with Soft Gain can be reset.
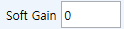
Figure: Soft Gain List
4.3.4 Main Toolbar: Scan View
The Scan View area provides the function to view collected data in various forms.
Scan View is a 2D graphical representation of ultrasonic data with rulers or scales corresponding to horizontal and vertical axes. For example, A Scan and C Scan are two types of Scans.
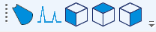
Figure: Scan View List
Scan View layout can configure one or more windows in various forms. For example, A-B-C layout means A Scan View, B Scan View, and C Scan View windows. In window arrangements with two or more viewing windows, cursor and zoom settings are applied to a specific single Scan View window.
Scan View represents ultrasonic signals in various ways, including signal overlays. Each Scan View has two axes. Also, each Scan View is linked with one Channel Group and displays only data corresponding to its own Channel Group. Therefore, in a layout with multiple Channel Groups, selecting and activating a desired Scan View will change the current Channel Group control at the top left to that Scan View’s Channel Group.
| List | Point of view | Axis content |
|---|---|---|
| A Scan | Looking into material | Amplitude vs US axis |
| B Scan | Side | US axis vs Scan axis |
| C Scan | Top | Scan axis vs Index axis |
| D Scan | End | US axis vs Index axis |
| S Scan | Side | US axis vs Scan axis |
Table: Scan View Screens
-
A-scan View The foundation for all other viewing windows. It displays received ultrasonic amplitude or waveforms by generating ultrasonic beams. Peaks in the signal correspond to reflected signals from reflectors or discontinuities within the test object. Generally, peaks at the start and end of the ultrasonic axis correspond to reflected signals from the specimen surface and backwall.
-
B-scan View A Scan View representing a 2-D side view of the test object showing ultrasonic data using one axis as Scan axis length and the other as ultrasonic path.
-
C-scan View A Scan View representing a 2-D top view of the test object showing ultrasonic data within the Gate Bar using one axis as Scan axis length and the other as Index axis length. One applicable variable (e.g., maximum amplitude) is projected onto the Index-Scan plane for each pixel. C Scan is also called Top View.
-
D-scan View A 2D surface display of the Index part and US data with scan length on one axis and US path on the other.
-
S-scan View A Scan View showing 2D ultrasonic data representing all A Scans generated by focal laws in an angular range or steering range to create a cross-section of the test object. A single A Scan is represented by a line where amplitude is converted to color, and the actual position is corrected via Wedge Delay so each data position accurately matches the ultrasonic axis.
-
Rulers Each ruler/scale has a dedicated color to help identify axes of different colors. The following table provides a list of available rulers/scales and related colors and functions.
Primary color is a property of each axis. Axes appear in various shades of the primary color. The brightest shade corresponds to raw data representation. Progressively darker shades relate to increased data correction complexity relative to the axis. Darker shades are also used for reference axes.
| Axis | Primary Color | Note |
|---|---|---|
| Scan | Blue | N/A |
| Index | Green | N/A |
| Amplitude | Yellow | N/A |
| Ultrasound | Pink | Sound Path |
| Purple | True Depth |
Table: Rulers Description
Note: Colors in this manual may vary slightly.
4.3.5 Main Toolbar: Reference / Measurement Bar
Reference / Measurement bars are activated in the Scan window when clicked.

Figure: Reference / Measurement Toolbar
The role of each Bar is for measuring defect size.
Measure defect size while adjusting active bars left/right or up/down.

Figure: Reference / Measurement Setup Screen
Differences in horizontal and vertical dimensions can be verified in the Minitool area.
Figure: Minitool Value Display Screen
4.3.6 Main Toolbar: Data Bar
The Data Bar is activated in the Scan window when clicked.
Figure: Data Toolbar
The Data Bar is a reference line specifying a particular scan position in collected PAUT data. Completed scan data contains image information for all positions traveled by the probe. Moving the Data Bar left and right simultaneously updates data collected at that position across A-scan, B-scan, C-scan, and S-scan views. Simply put, the Data Bar is a reference point for “viewing data at this position.”
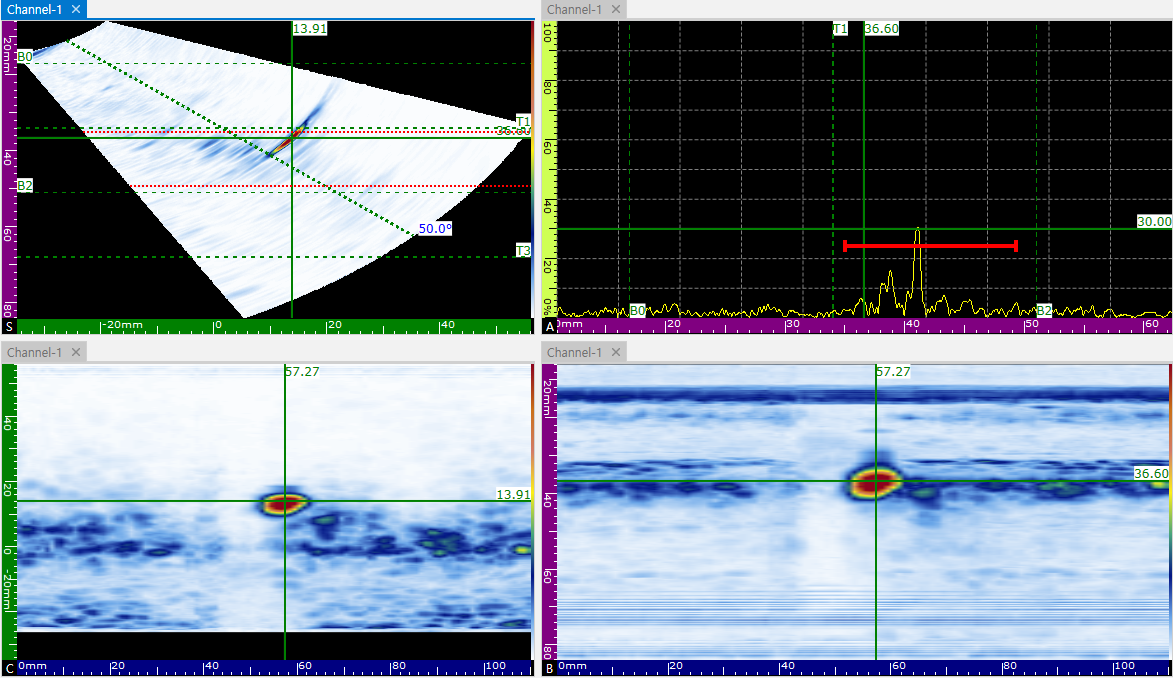
Figure: Screen change upon Data Bar movement
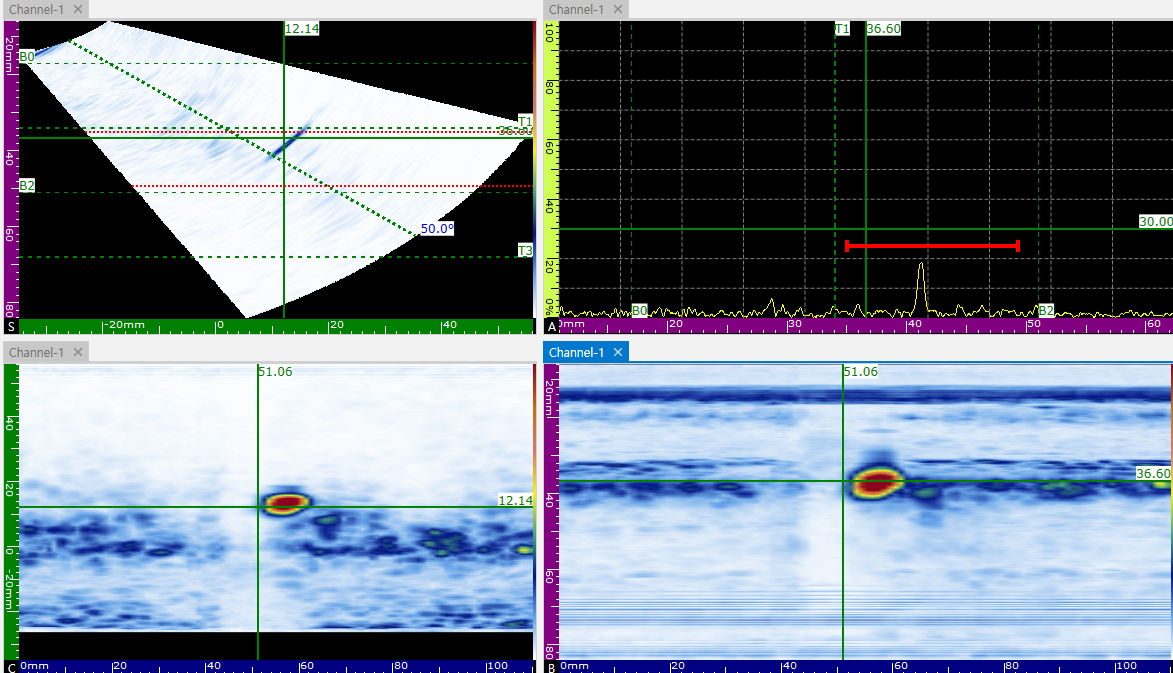
Figure: Screen change upon Data Bar movement 2
4.3.7 Main Toolbar: Gate
Consists of a total of 3 gates: A / B / I Gate.

Figure: Gate Toolbar
Gates are activated by clicking and displayed on the A-scan. Also, active gates are displayed on the S-scan so you can see on screen where measurements are being taken.
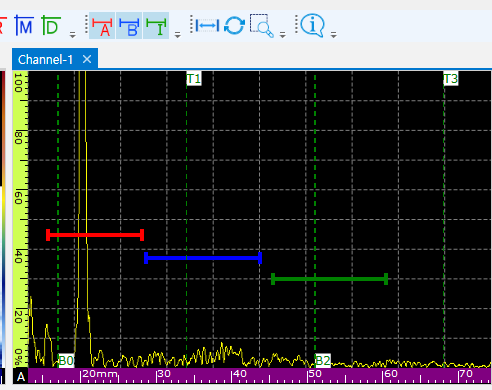
Figure: A-scan screen after Gate activation
Gates displayed on S-scan are shown according to the Gate Type previously set in Inspection.
- Gate type: True Depth / Sound Path
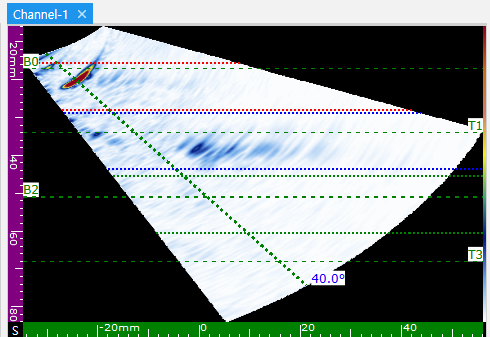
Figure: S-scan Gate display screen
Gates can be used to set the Index area for C-scan. Also, height and position of signals captured in the gate can be verified.
4.3.8 Main Toolbar: Zoom mode & Zoom reset
Zoom mode is a function used to magnify defects or specific positions in collected data.
Figure: Zoom mode Toolbar
Activated by clicking Zoom mode; dragging the mouse on screen displays an area and magnifies that position.
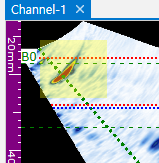
Figure: Zoom mode active screen
Zoom mode is frequently used during measurement as it allows detailed viewing of defect positions.
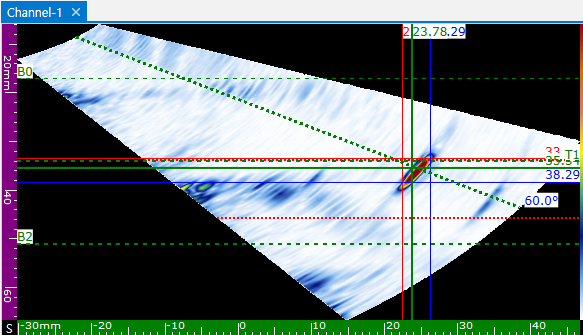
Figure: Screen without Zoom mode applied
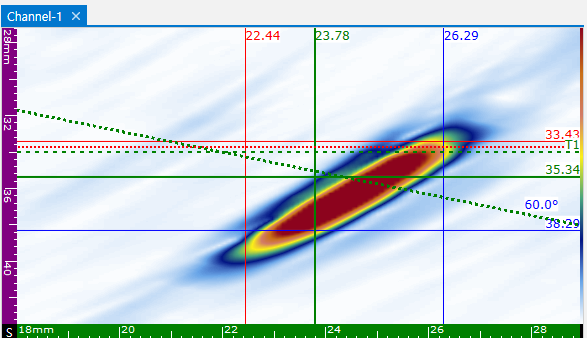
Figure: Screen with Zoom mode applied
Zoom reset restores the magnified screen to its original state.
Figure: Zoom reset Toolbar
4.3.9 Main Toolbar: Measure tool
Measure tool is activated by clicking and opens the Measurement window.
Figure: Measure tool Toolbar
The Measurement window allows verifying height and position of signals captured in gates.
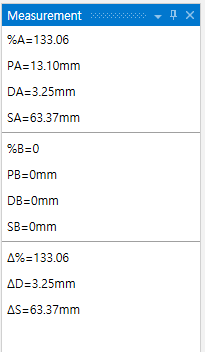
Figure: Measurement Window
Gates consist of A / B / I; descriptions for each value are as follows:
| Button | Unit | Description |
|---|---|---|
| A%, B%, I% | % | Amplitude (%) screen height for A, B, I |
| SA, SB, SI | mm | Soundpath of echo in A, B, I Gate |
| DA, DB, DI | mm | Reflector depth in A, B, I Gate |
| PA, PB, PI | mm | Distance to reflector from 0mm reference in A, B, I Gate |
The triangle icon represents the difference between A / B Gates.
4.4 Sub Toolbar
Sub Toolbar is a list assisting in verifying values for parts operating on screen.
Sub Toolbar consists of Parameters / Color map / Measure Tool / Gate Range Control / Calibration.
Each item can be activated by clicking.
4.4.1 Parameters
Parameters is a list showing setting values used when collecting data.
Clicking this list immediately activates it to check values and details of each setting.
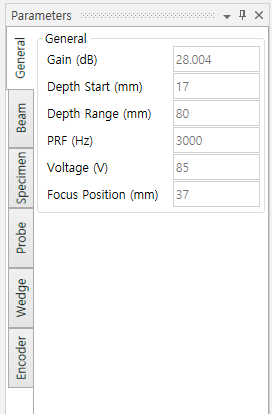
Figure: Parameters window screen
Items configurable in the Parameters window include Specimen, which can be manipulated if detailed settings are required.
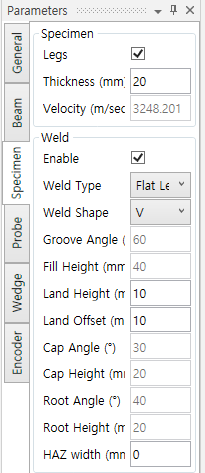
Figure: Parameters Specimen screen
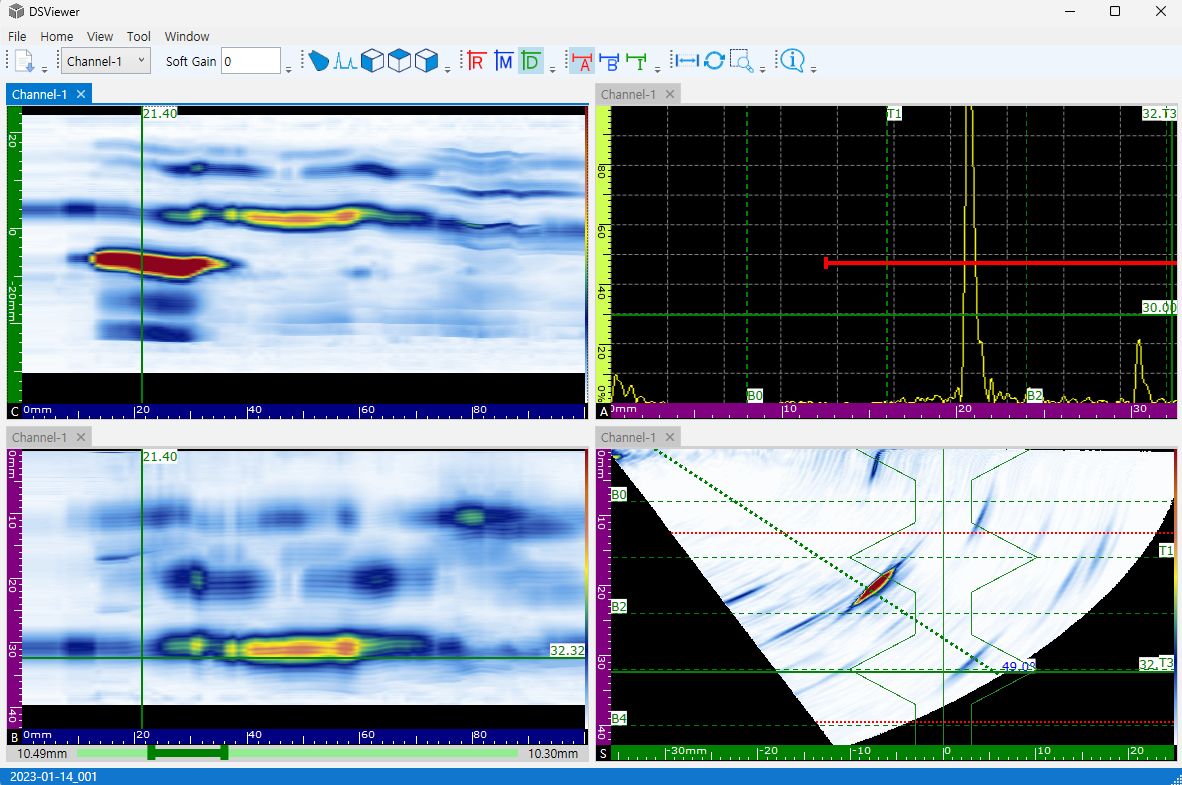
Figure: Specimen applied screen
4.4.2 Color map
Color map is a color range setting window used for measuring corrosion.
Activated by clicking the list.
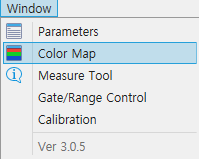
Figure: Color map screen
Color Map is divided into two types:
First is a generally used Color Map based on A^.
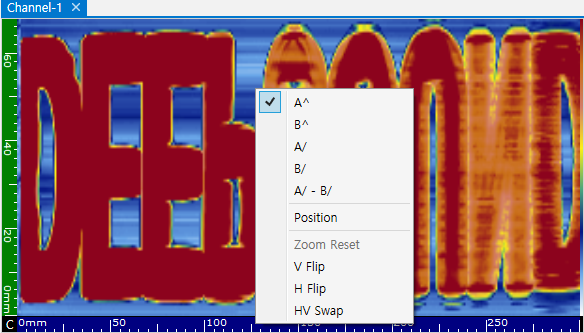
Figure: Color Map A^ applied screen
Second is the Color Map used when performing Corrosion mapping.
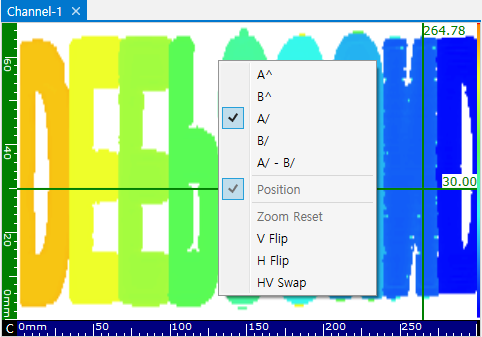
Figure: Color Map A Position applied screen
Corrosion Color Map is automatically applied when changing to A/, B/, A/-B/, or Position.
Also, to further distinguish color differences, Min / Max can be used to reset range differences. Linear and Reverse functions allow smoothing or inverting colors.
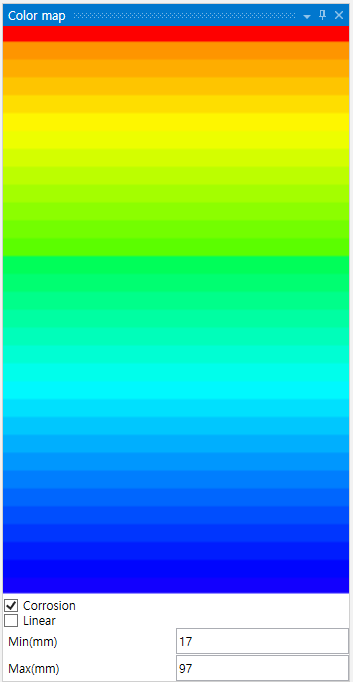
Figure: Color Map Toolbar
Color map allows finer adjustment of color differences so even minute thickness variations can be easily distinguished visually.
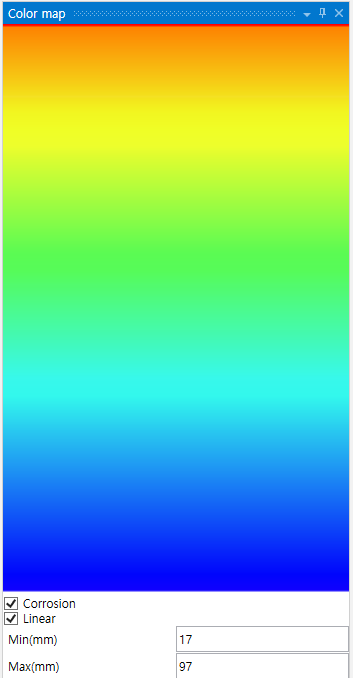
Figure: Color map Linear applied screen
4.4.3 Gate/Range Control
Figure: Gate/Range Control List
Gate / Range Control is a list for readjusting position settings for Gates and setting values for View Range.
-
Gate: Select desired Gate via Kind to change position by setting Start / Range / Threshold.
-
View Range: A frequently used function when wanting to see only specific areas while excluding others. After setting approximate positions in the Scan window, View Range Control can be used to readjust precise position values.
4.4.4 Calibration
Calibration is a function for verifying parts related to calibration.
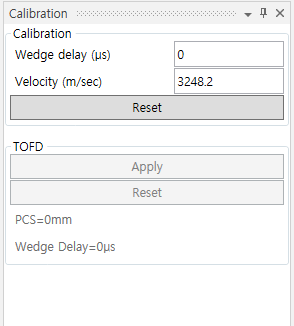
Figure: Calibration List
Calibration includes Wedge delay / Velocity and even TOFD. Adjusting these values reflects them in each Ruler without changing the image.
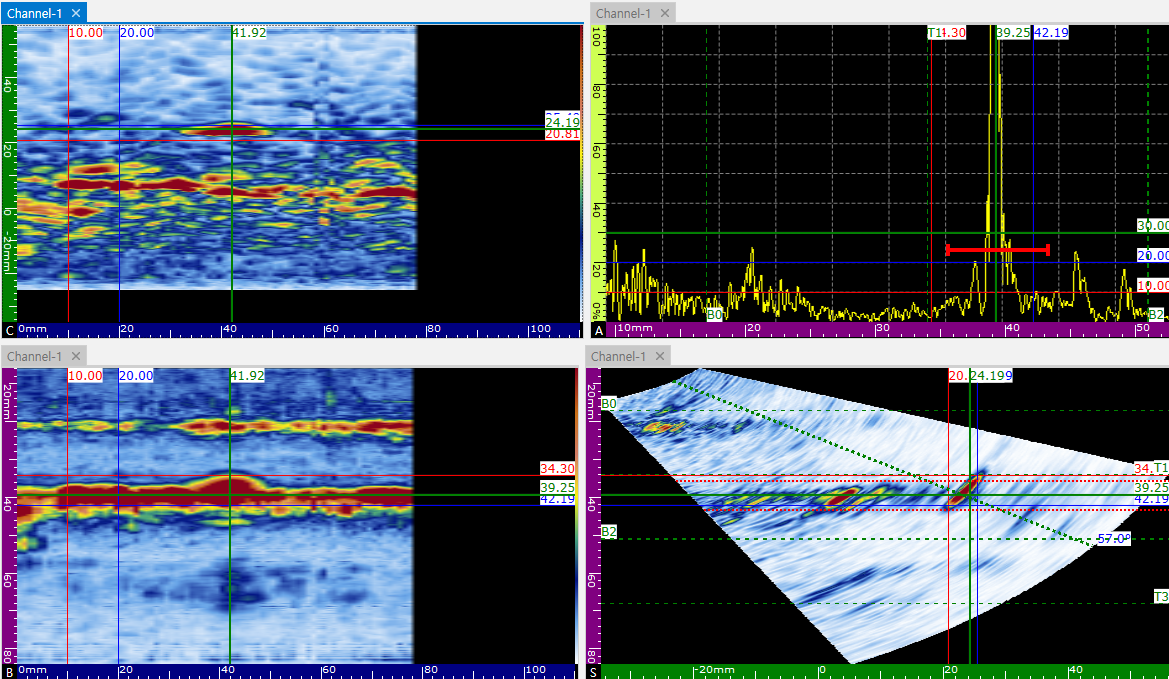
Figure: Calibration Applied Screen
5. Shortcut Key Operation
DSViewer allows easily activating certain objects with several shortcut keys.
| Item | Shortcut Key | Description |
|---|---|---|
| Zoom | Mouse wheel | Zoom in/out centered on the window |
| Ctrl + Left mouse drag | Pan screen while zoomed |
Important Notice:
SEONGSANLAB Co., Ltd. may modify, improve, or make other changes to products and services at any time and may discontinue products or services without prior notice. Users should obtain the latest relevant information before placing orders and ensure such information is current and complete. All products (hardware and software) are sold according to the sales conditions of SEONGSANLAB Co., Ltd. upon order approval.
If you cannot find an appropriate solution to the contents of this manual, please send it to SEONGSANLAB Co., Ltd. by email or mail to the address below. Also, please send any suggestions for further improvement.
Mailing Address: #1318, 13F, Ace High Tech City, 52 Gongdan-ro 140beon-gil, Gunpo-si, Gyeonggi-do, Republic of Korea
Email: admin@dspaut.com
Copyright © 2026, SEONGSANLAB Co., Ltd.
This manual is protected by domestic/international copyright laws. No part of this manual may be reproduced, distributed, translated, or transmitted in any electronic, magnetic, optical, chemical, manual, or other form without prior written approval from SEONGSANLAB Co., Ltd.
All rights reserved