DSVision Software Manual
- Software Version: v3.0.5
- Manual Version: v1.0
- Release Date: 2026-04-21
- Last Updated: 2026-04-21
- Author: SEONGSANLAB Co., Ltd.
1. Introduction
1.1 Overview
- DSVision is a dedicated data acquisition and analysis software for Phased Array Ultrasonic Testing (PAUT).
- Supports PA, LA, TOFD, and Conventional inspection methods.
- Compatible Devices: P5 / B3 / T3 / R5
1.2 Purpose
- This manual is designed to explain the procedures and functions for installing, operating, and configuring the DSVision software.
- The goal is to ensure correct use of the software and to derive accurate inspection results.
1.3 Target Audience
- Professional NDT inspectors and engineers.
- Prior knowledge of the following is required before operating this software:
- Ultrasonic Non-Destructive Testing methods
- Operation of NDT equipment
- Lack of knowledge in the above areas may result in incorrect inspection findings.
2. Software Installation Manual
- This section describes the program installation and initial startup procedures.
2.1 Software Program Installation
- For a smooth installation, perform the process in a Windows 10 desktop environment. Follow these steps:
- Unzip the installation file (.zip), copy the entire program folder to a USB drive, and insert it into the USB hub on the right side of the device.
- Connect a keyboard and mouse to the dedicated ports or USB hub for operation and access the standard Windows 10 desktop interface.
 install_program/images/2.png)
 install_program/images/4.png)
 install_program/images/5.png)
 install_program/images/6.png)
2.2 Auto start Program setting
- This device is configured to run the software automatically upon system startup. If manual configuration is needed, follow these steps:
- Press ‘Windows Key + R’ on the keyboard to open the Run window, and type shell:startup in the input box to open the ‘Startup’ folder.
How to Register a Program for Automatic Startup/image/3.png)
How to Register a Program for Automatic Startup/image/4.png)
How to Register a Program for Automatic Startup/image/5.png)
How to Register a Program for Automatic Startup/image/7.png)
How to Register a Program for Automatic Startup/image/8.png)
How to Register a Program for Automatic Startup/image/9.png)
3. List of Abbreviations
Detailed definitions of major technical terms and abbreviations used in this manual and software.
3.1 Inspection Methods
- NDT (Non-Destructive Testing): Inspecting defects without destroying materials.
- UT (Ultrasonic Testing): Inspection using ultrasonic waves.
- PA (PAUT) (Phased Array Ultrasonic Testing): Ultrasonic method using multiple elements for phased arrays.
- LA (Linear Array): Linear array ultrasonic method.
- TOFD (Time of Flight Diffraction): Precision defect interpretation method using the time difference of diffracted waves.
- TFM (Total Focusing Method): A method that focuses at every point in the target area.
- FMC (Full Matrix Capture): A data acquisition method to implement TFM.
- Conventional (Conventional UT): Standard ultrasonic method using a single element.
3.2 Software & Display
- A-Scan (Amplitude Scan): Display of ultrasonic reflection signal amplitude over time (or distance).
- B-Scan (Brightness Scan): 2D image showing a cross-section of the test object.
- C-Scan (Constant-depth Scan): Top-view plan image of the test object (e.g., for corrosion mapping).
- S-Scan (Sectorial Scan): Sector-shaped cross-sectional image represented by sweeping the beam angle.
- FSH (Full Screen Height): Echo height expressed as a percentage of the total screen height.
- Gate (A, B, I Gate): Monitoring areas set for signal detection, measurement, and alarms.
3.3 Acquisition & Calibration
- PRF (Pulse Repetition Frequency): The rate at which ultrasonic pulses are transmitted per second.
- TCG (Time Corrected Gain): Gain that varies over time to compensate for signal attenuation due to distance.
- DAC (Distance Amplitude Curve): A curve showing the relationship between distance and amplitude (standard for defect size evaluation).
- RF (Radio Frequency): Pure high-frequency sinusoidal waveform without filtering or rectification.
- Gain (Gain (dB)): Amplification of the received signal (Unit: dB).
- Focal Law: Beam control law that calculates the delay time of each element during PA inspection.
- Velocity (Sound Velocity): The speed of ultrasound travel within a specific test object (m/s).
- HAZ (Heat Affected Zone): The area of base metal whose microstructure has been altered by heat during welding.
- V, W, S, T (Velocity, Wedge, Sens, TCG): Indicators representing calibration status.
3.4 Hardware & Interface
- Encoder: A sensor connected to the device to measure probe position and scan distance.
- Wedge: A medium attached in front of the ultrasonic probe to create a refraction angle.
- Probe (Probe (Transducer)): A core component that transmits and receives ultrasonic signals.
4. Device Software Functions
- DSVision is a dedicated software for real-time data acquisition and multi-angle analysis for ultrasonic NDT.
- Real-time Data Acquisition: Provides lag-free real-time images through high-speed signal processing.
- Support for Various Modes: Inspection modes such as PA, TOFD, and Conventional can be operated individually or simultaneously within the software.
- Data Storage: Acquired raw data and analyzed data are stored within the software.
4.1 Screen Layout
- The software screen consists of four areas: Top menu, Left menu, Right menu, and Center screen.
- Top Menu: Displays core inspection status information such as Gain values and encoder position.
- Left Menu: Controls operational functions like changing screen configurations and starting/stopping inspections.
- Right Menu: Configures inspection parameters such as Pulse, Probe, and Specimen.
- Center Screen: Outputs A-Scan, B-Scan, S-Scan, and C-Scan images corresponding to the acquired signals.
4.2 Operation Method
- The software supports two operation methods: Touchscreen and Mouse/Keyboard.
- Touch Operation:
- Click: Select menus and buttons or call setup windows.
- Drag: Drag screen areas to specify a data range or zoom into a section.
- Mouse & Keyboard Operation: Supports fine parameter adjustment using a mouse and precise numerical input via a keyboard.
5. Menu explanations
The menu of the DSVision program consists of four areas—Top, Bottom, Left, and Right—designed to allow inspectors to operate with minimal eye movement while focusing on the real-time images in the center screen. The Left menu controls operational functions like starting/stopping inspections, screen capture, and Zoom, while the Right menu configures detailed parameters such as probe and gate settings and layout selection. The Top and Bottom areas are used for monitoring purposes to adjust Gain and check the current system’s calibration status and core inspection values in real-time.
5.1 Main Window
- The main interface of DSVision provides a screen resolution optimized for display environments and a structure designed to maximize the visibility of inspection data.
- Center Screen: Converts acquired signals into real-time images and displays A, B, S, and C-Scan screens in single or multi-split formats depending on layout settings.
- Menu Placement Areas: Operational menus on the left, configuration menus on the right, status information on top, and calibration indicators at the bottom are arranged around the center screen for immediate setting changes during analysis.
- Inspection Optimization: The software automatically optimizes and displays the screen configuration based on the selected inspection mode (PA, TOFD, Conventional).
DSVision Main Screen Configuration
5.2 Toolbar explanations
Each toolbar in the software is placed in an optimized position by function, allowing users to monitor and control simultaneously according to the inspection situation. The Top and Bottom areas are used to check inspection reliability by constantly exposing real-time data values and calibration status, while the Left and Right areas provide a control interface for actual inspection operation and detailed parameter settings to maximize work efficiency. Detailed functions and operation methods for sub-menus included in each toolbar area are as follows.
5.3 Top Toolbar explanations
The top toolbar is an area for real-time monitoring of core values and system status during inspection. It is configured so that inspectors can check major parameters or immediately adjust Gain while analyzing center images.

Top Toolbar Configuration Overview
5.3.1 Gain Control
A function to adjust the amplification of the inspection signal in real-time.
- Operation Method: Selecting the Gain value area calls up a virtual keypad for direct input and application of desired values.
- Fine Control: Provides the ability to finely adjust in 0.1 dB increments within a maximum 10 dB range or quickly increase/decrease values in 6 dB increments.
 program_introduction/images/16.png)
Gain Control Keypad Screen
5.3.2 Information Panel (Amplitude, P, D, S)
Outputs real-time measurement information of the signal captured based on the active Gate.
- Amplitude (%): Displays the intensity of the maximum echo detected within the gate as a percentage.
- Primary (P): Indicates the straight-line distance from the probe to the point where the signal is detected.
- Depth (D): Indicates the vertical depth of the point where the signal is detected within the test object.
- Sound (S): Outputs the position distance on the Sound Path.
 program_introduction/images/15.png)
Gate Measurement Information Panel
5.3.3 Encoder Location Information
Monitors real-time position information transmitted from the current scanner or probe transport device.
- Position Output: Displays the total distance traveled from the zero point set at the start of the program.
- Warning Status: If measured values exceed pre-set inspection ranges or an anomaly occurs in the encoder signal, the numerical display area is highlighted in red to provide a visual warning.
 program_introduction/images/slide_74_img_15.png)
Encoder Position and Warning Notification
5.4 Left Toolbar explanations
The left toolbar is the area for controlling major operational functions and configuring system environment. Inspectors can operate inspection status while keeping an eye on real-time data on the center screen. The toolbar includes functions for starting and stopping inspections, Auto Gain, and screen zoom or full-screen mode for detailed analysis.

Left Toolbar Configuration
5.4.1 Preferences (Setup, Image, Data, Device)
Calls up system settings and various data management menus.
 program_introduction/images/12.png)
Preferences Icon
- Setup: A menu to manage parameter setting values. Performs Save (save current settings to internal drive), Load (load saved setting files), Delete, and Copy (copy files to external USB).
 program_introduction/images/slide_50_img_10.png)
Setup Configuration Screen
- Image: Manages the list of images saved through the Screen Shot function. Provides a preview when an image is selected, and allows for Copy to USB or Delete.
 program_introduction/images/slide_51_img_15.png)
Image Management Screen
- Data: Manages the list of acquired raw inspection data. Supports data preview and includes Copy to USB, Delete, and Open Viewer functions. It also displays the remaining storage capacity of the device’s internal drive.
 program_introduction/images/slide_52_img_19.png)
Data Management Screen
- Device: Controls system device settings.
- LCD Brightness: Adjusts the brightness of the display screen.
- GateLine Horn: Configures whether to activate an audible alarm when the echo signal exceeds the gate threshold (On/Off).
- Information: Check hardware specifications and software version.
- Minimize: Minimizes the program and switches to the Windows 10 desktop.
 program_introduction/images/slide_54_img_6.png)
Device Configuration Screen
5.4.2 Inspection Button (Start, Pause, Stop)
Controls real-time data acquisition and recording modes.
 program_introduction/images/slide_57_img_15.png)
List Configuration During Inspection Save
- Start: Clicking this switches the program to active Inspection Mode. During inspection mode, hardware settings and major parameters are locked and cannot be changed.
- Pause: Temporarily pauses data acquisition. When not in inspection mode, it performs a standard Freeze function. During inspection mode, it does not record data even if the encoder moves. Used to readjust scanner position and resume from the point of interruption.
- Stop: Active only during inspection mode. Terminating data acquisition brings up a window to name the file and finally save the acquired data.
 program_introduction/images/13.png)
Example of Active Inspection Mode
5.4.3 Screen Shot (Screen Capture)
Immediately saves the entire current display, including the center screen area, as an image file.
 program_introduction/images/slide_59_img_5.png)
Screen Shot Icon
- Saving Method: Clicking the button immediately captures the current screen without a separate confirmation window.
- File Format: Image files are saved with a
.pngextension. - Default Save Path:
C:\DEEPSOUND\DSVision\Bin\RES\User\Image
 program_introduction/images/slide_59_img_11.png)
Saved Image Verification Screen
5.4.4 Auto Gain
Immediately adjusts the amplitude of the measured signal to a pre-set target value.
 program_introduction/images/slide_61_img_4.png)
Auto Gain Icon
- Working Principle: Automatically detects the highest peak among signals currently located within the A Gate area and adjusts the amplification.
- Standard Value Setting: Adjusts the signal height based on the percentage (%) specified in the Auto FSH list of the right configuration menu.
- Usage: Normalizes the signal to a standard height required by specifications (e.g., 80% FSH) with a single click, eliminating the need to manually adjust Gain multiple times.
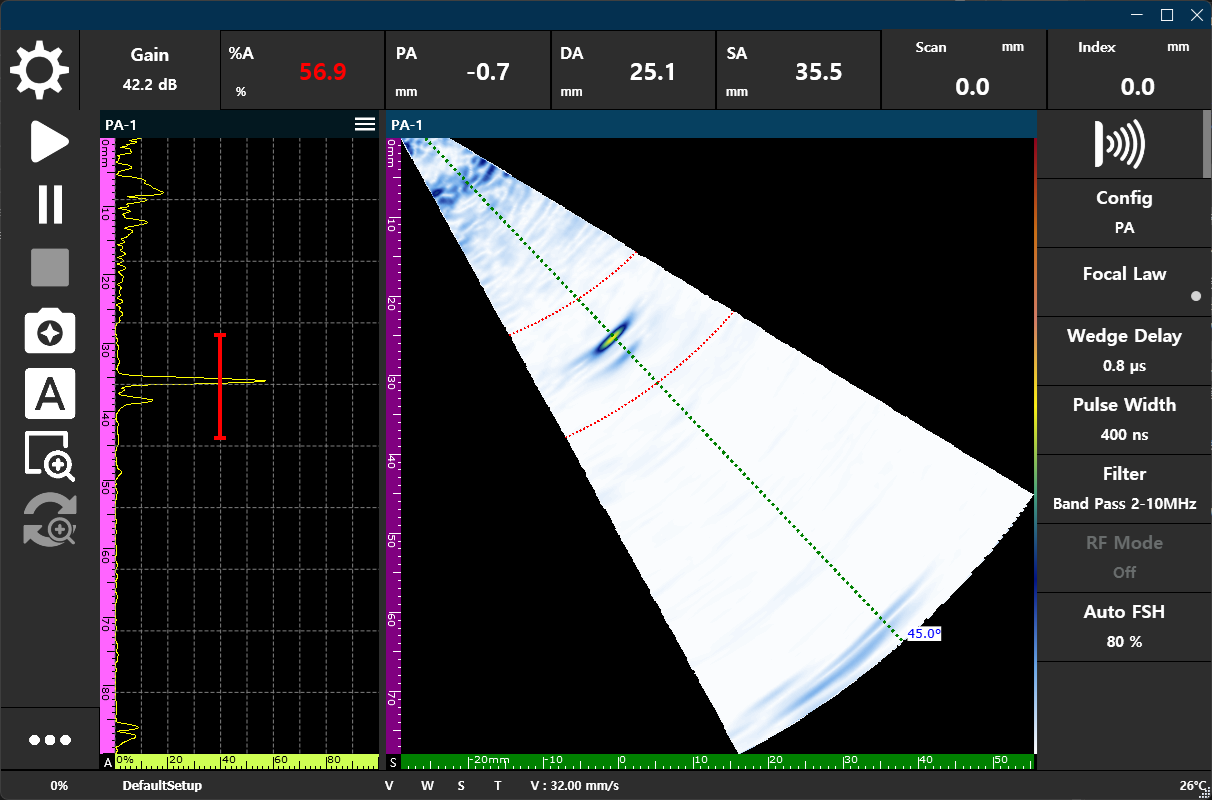
 program_introduction/images/slide_61_img_15.png)
 program_introduction/images/slide_61_img_17.png)
Comparison Before (Left) and After (Right) applying Auto Gain
5.4.5 Zoom & Zoom Reset
Performs detailed analysis by zooming into specific screen areas or restoring them to their initial state.
 program_introduction/images/14.png)
Zoom and Reset Icons
- Zoom: Becomes active in orange when clicked; creating a Zoom Box by touch-dragging over the desired area will zoom into that section.
- Zoom Type: Users can zoom horizontally, vertically, or diagonally depending on settings.
- Reset: Restores all zoomed screens to their initial standard magnification and layout with a single click.
5.4.6 Full Screen Mode
Maximizes visibility during defect detection and precision measurement by extending the center data output area to the full screen.
 program_introduction/images/slide_65_img_19.png)
Full Screen Icon
- How to Enter: Press the More key at the bottom left, then click the Full Screen icon in the appearing menu.
- Active Status: All menu bars are hidden and the selected layout fills the entire screen, allowing focus on detailed analysis.
- How to Exit: Click the Exit icon displayed at the bottom right of the screen to return to the original view.
 program_introduction/images/slide_65_img_31.png)
Active Full Screen Mode
5.4.7 Information Box (Gate Details)
Displays an information box on the screen to check all measurement indicators and detailed data for the active Gate at a glance.
 program_introduction/images/slide_67_img_5.png)
Information Box Icon
- How to Activate: Press the More key at the bottom left, then click the Information Box icon in the appearing menu.
- Major Functions: Comprehensively outputs real-time measurement values such as amplitude and position (P, D, S) for gates. In particular, %, D, and S items automatically calculate and display the difference in values between Gate A and Gate B, making them useful for relative comparative analysis between two signals.
- Usage: Used not only for real-time gate value monitoring but also for constant verification of the system’s calibration status.
- How to Exit: Click the X button at the top right of the information box to hide it from the screen.
 program_introduction/images/slide_67_img_15.png)
Active Information Box Screen
5.5 Setting toolbar explanations
The right configuration toolbar is the area for setting and controlling all detailed software parameters. All numerical values required for inspection—from ultrasound generation settings to test object information and gate management—are input and adjusted here.

Configuration of Right Toolbar and 9 Functional Groups
- Functional Group Configuration: Categorized into a total of 9 functional groups:
- General: Basic inspection range and PRF settings
- Pulse: Beam generation and pulse control
- Specimen & Weld: Test object and weld profile configuration
- Probe & Wedge: Sensor and wedge information management
- Scan & Encoder: Inspection scan method and encoder settings
- Gate & Alarm: Data acquisition intervals and alarm settings
- Layout & Display: Screen layout and display mode selection
- Palette: Echo and color palette adjustment
- TCG/DAC: Signal attenuation compensation settings
- Operation Method: Click the title bar of each group to expand or collapse detailed parameter windows. All numerical values modified in the toolbar are immediately reflected in the signal data on the center screen.
5.5.1 General Settings
This is the most basic control panel for the device, where the inspector determines the depth (Depth) to be viewed and the physical intensity (Voltage) of the signal. Like adjusting zoom and brightness on a camera, this parameter group sets the optimal viewing environment before starting an inspection.
 program_introduction/images/slide_8_img_3.png)
General Settings Components
- Depth Start: Sets the starting point (near-range depth) of the inspection area to be displayed on screen.
- Depth Range: Sets the overall range of depth to be inspected.
- PRF (Pulse Repetition Frequency): Adjusts the repetition rate of ultrasonic pulses per second. Directly affects inspection speed and data resolution, adjustable from 100 Hz to a maximum of 30,000 Hz.
- Voltage: Controls penetration by adjusting the voltage intensity of the transmission signal. Can be adjusted between 25 V and 160 V to optimize for material and thickness.
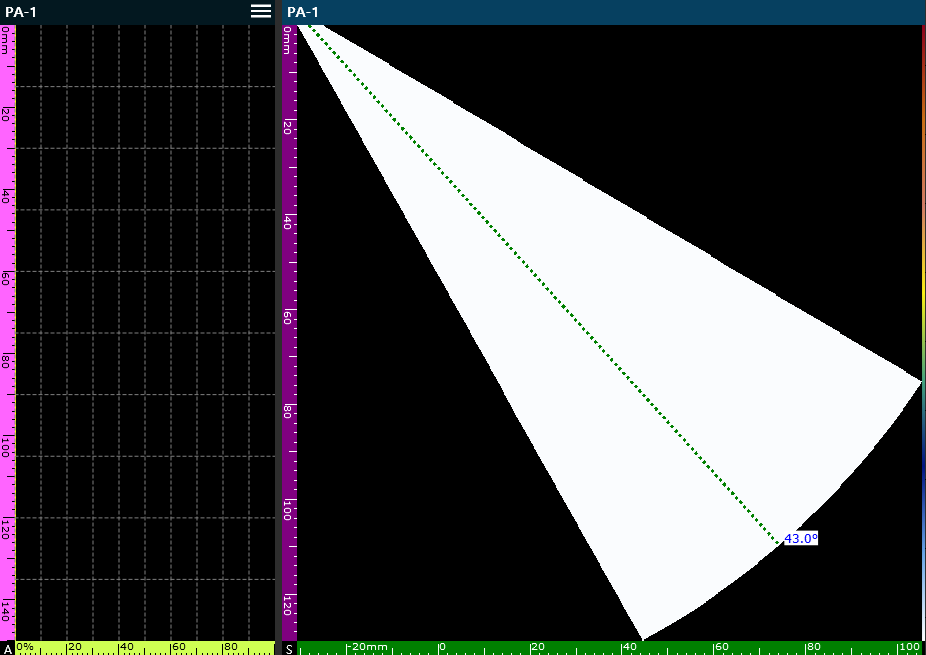
- Focus Position: Electronically adjusts the focal point of the beam to concentrate energy at a specific depth. Utilized as follows to obtain optimal inspection results in specific areas:
- Improved Resolution: The beam width is narrowest at the focal point, allowing for clear separation and interpretation of adjacent defects.
- Increased Signal Intensity: Since energy is concentrated at one point, a higher signal can be obtained even for the same defect when focused.
- Image Sharpness: Defect shapes are observed more sharply and clearly on the S-Scan, increasing interpretation accuracy.
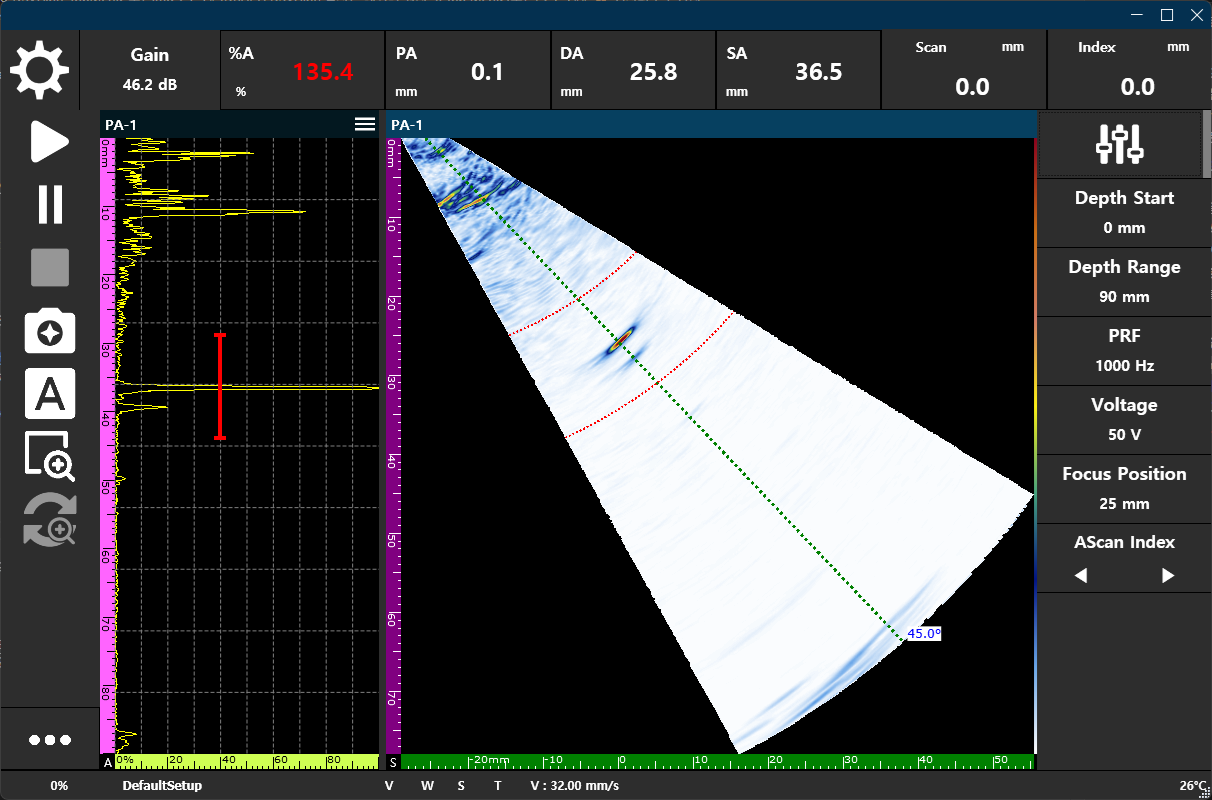
25mm Setting: Captures sharp surface defects by focusing on shallow depths
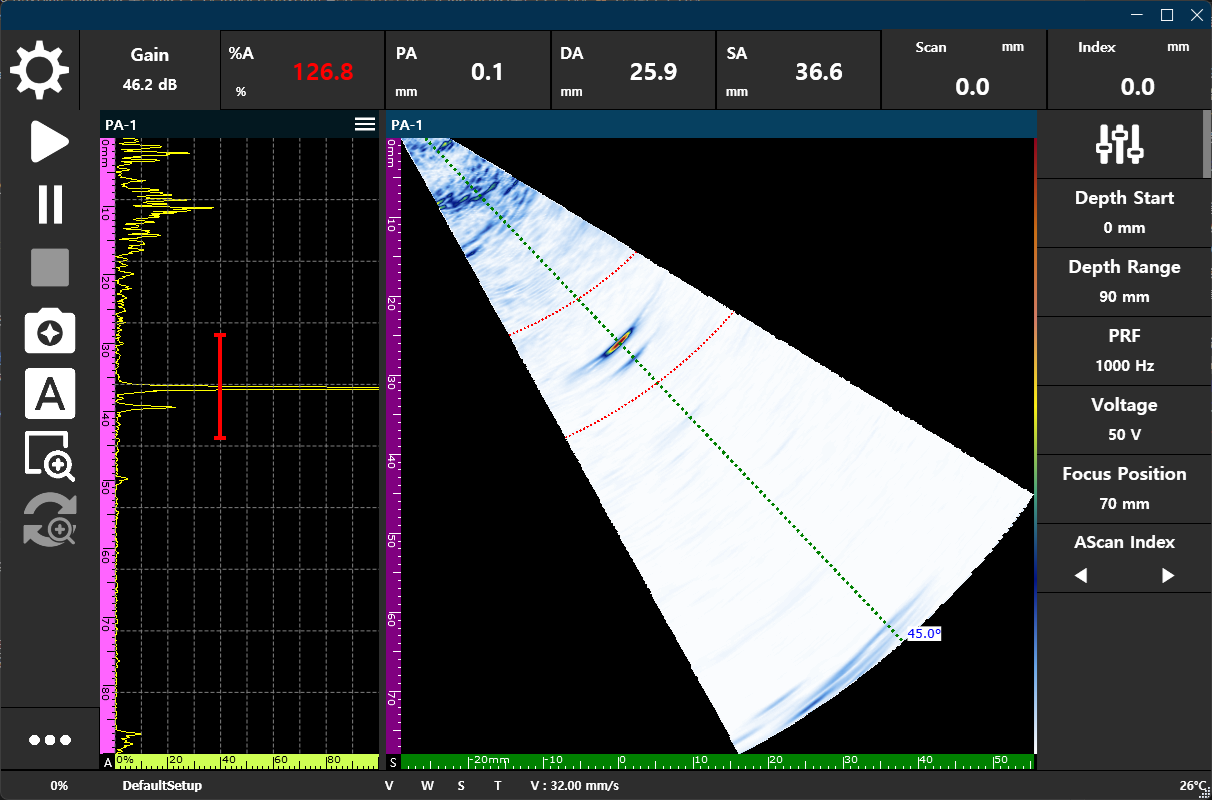
70mm Setting: Enhances internal resolution of thick base metals by focusing on deep levels
- Vector Index: Moves the active focusing line to a specific vector position to change the reference point for data analysis.
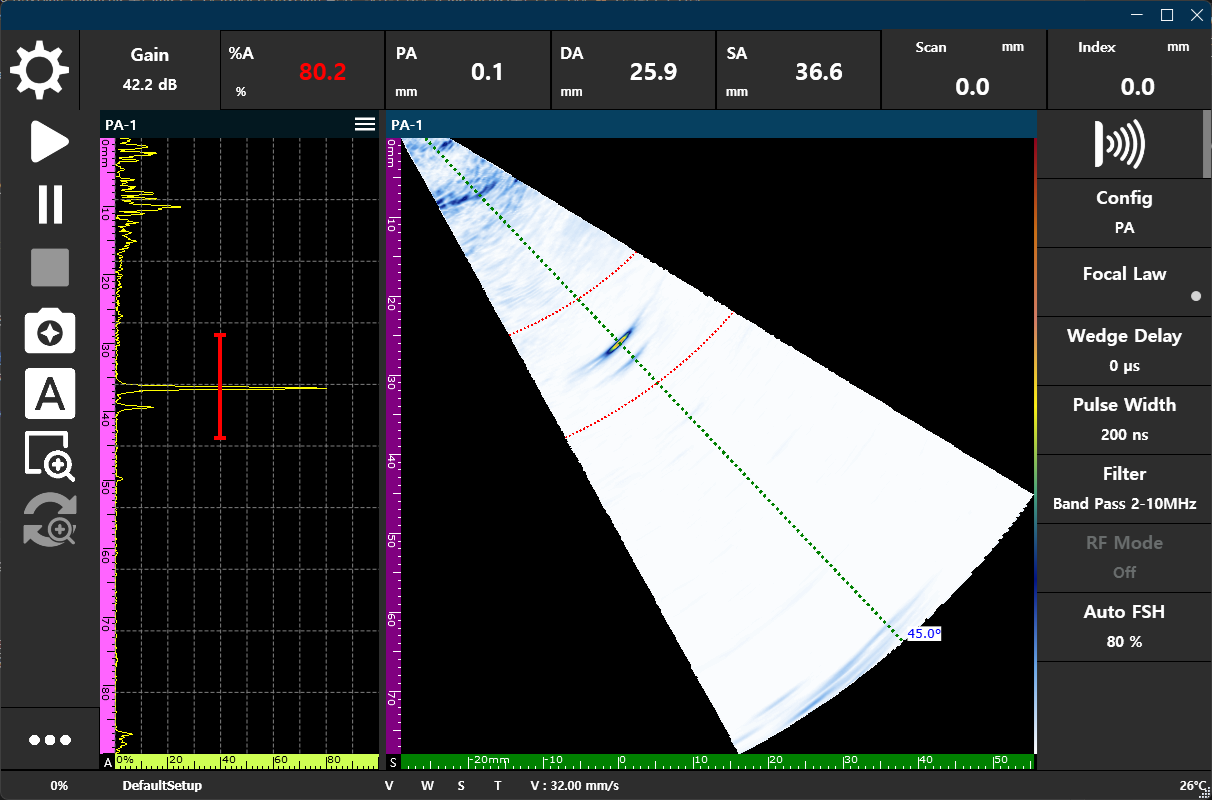
5.5.2 Pulse Settings
Controls at a hardware level how ultrasonic beams are generated and transmitted into the test object. This is a critical setting for determining signal quality—an optimization process to minimize noise and maximize effective signals through harmony with the transducer.
Configuration
Select the core ultrasonic method to be used for inspection.
- PA (Phased Array): Select when multi-angle sweep inspection is required.
- LA (Linear Array): Select when linear scan inspection with constant sensitivity is required.
- Conventional: Select for conventional UT or TOFD inspection.
Focal Law
Configures beam steering and focusing methods according to the mode selected in Configuration.
- PA (Phased Array) Mode
- Beam Angle Start/Stop: Sets the start and end angles for the Sectorial Scan (e.g., 35° to 75°).
- Angular Resolution: Sets the angular interval between beams.
- Effect: Covers multiple angles simultaneously with a single scan, increasing probability of detection (POD) and efficiently inspecting welds with complex geometries.
- LA (Linear Array) Mode
- Aperture Size: Sets the number of elements to be grouped to form a single beam.
- Step Interval: Controls the horizontal movement interval of the aperture across the element array.
- Effect: Maintains a constant angle of incidence while quickly scanning a wide area, suitable for corrosion mapping and plate inspection.
Wedge Delay
Compensates for the time ultrasound travels through the wedge to accurately calculate the actual spatial coordinates of defects.
- Auto Calibration: Automatically calculates travel time within the wedge using a reference specimen (e.g., R100). The W indicator in the bottom status bar activates in orange upon completion.
- Correction Effect: Accurate input of delay values aligns signals on A-Scan and S-Scan with actual physical positions within the specimen.
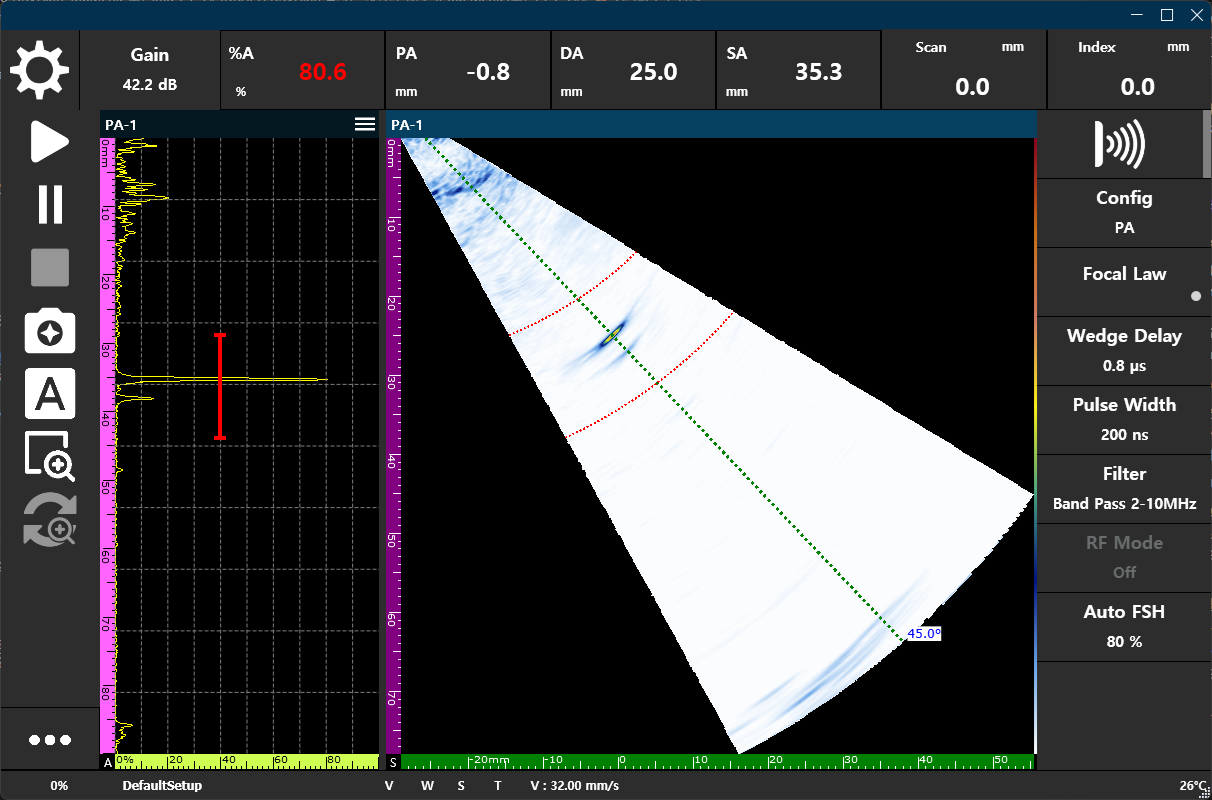
Pulse Width
Adjusts the temporal duration of electrical energy applied to the transducer.
- Frequency Matching: Highest energy efficiency and cleanest signals are obtained when set to half the period (T/2) of the transducer’s center frequency.
- Setting Effect: If pulse width is mismatched, signals weaken and smearing occurs, reducing interpretation efficiency.

Filter
Filters out unnecessary noise and clearly extracts the unique frequency band of the transducer.
- SNR Improvement: Suppresses background noise and increases signal-to-noise ratio (SNR), allowing for clear identification of defect peaks.
- Band Pass: Sharpens signal boundaries by simultaneously blocking low and high-frequency noise.
Auto Gain / Auto FSH
Instantly settles signal height to a target value (Full Screen Height, FSH) with a single click.
- Target Setting: Signal height can be normalized to 80% FSH (widely used in industry standard calibration), as well as 30%, 50%, etc.
- Working Principle: Automatically calculates and applies Gain value based on the maximum peak within the currently active Gate.
RF Mode
Active in TOFD or Conventional modes; outputs original high-frequency waveforms before rectification for use in phase change analysis, etc.
5.5.3 Specimen & Weld Settings
This parameter group acts as a ‘map’ for converting acquired wave signals into 3D spatial coordinates of the actual metal specimen. Accurate input of specimen thickness and weld geometry is essential to interpret where a signal is located in terms of depth and position without error.
Specimen Settings
Defines the physical boundaries and acoustic characteristics of the test object.
- Velocity: Sets the speed at which ultrasound travels within the material. Serves as a reference for converting signal time into distance.
- Setting Method: Use standard sound velocity libraries for common materials like carbon steel or stainless steel, or manually input numbers for fine adjustment.
- Velocity Calibration: Supports a function to calculate actual sound velocity using reference blocks of known thickness. Calculated values are automatically applied to the system upon completion.
- Thickness: Enter the actual thickness of the test object. This serves as a spatial boundary for calculating beam reflection points (Legs).
- Reflection: Changing thickness values moves the Backwall line on the S-Scan in real-time to check alignment with actual echo signals.
- Curved Surface Handling: Visualizes accurate beam paths not only for plates but also by combining diameter and thickness for curved specimens like pipes.
- Legs: Displays points where the ultrasonic beam reflects inside the specimen as guide lines on the screen.
- B (Bottom): Bottom reflection points (B0, B2, etc.)
- T (Top): Top reflection points (T1, T3, etc.)
- Usage: If a defect signal is found between B0 and T1, it proves that it was captured in the section reflecting back up from the bottom (1-Skip).
%20program_introduction/images/slide_13_img_21.png)
%20program_introduction/images/slide_14_img_11.png)
Weld Settings
Configures weld profile and specifications to interpret whether a defect is located within the weld, at the root, or in the Heat-Affected Zone (HAZ).
- Weld Type: Select the actual weld cross-section geometry.
- V-type / Inverted V-type: Standard and inverted shapes for single-butt welding.
- X-type (Double V): Double-sided welding structure for medium plates and above.
- Weld Shape:
- Symmetric: Left-right symmetrical weld.
- Flat Left / Flat Right: Asymmetrical structures where one wall is vertical, or for T-joint inspections.
- Geometric Parameters:
- Groove Angle: Sets the bevel angle to increase accuracy in interpreting Fusion Line defects at weld boundaries.
- Fill / Land Height: Sets actual weld bead and root land heights.
- Land Offset (Gap): Visualizes horizontal gap between base metals to assist in root defect interpretation.
%20program_introduction/images/slide_19_img_3.png)
%20program_introduction/images/slide_20_img_3.png)
- HAZ (Heat-Affected Zone): Sets the width of the section where metal structure has been altered by heat from the weld boundary.
- Function: Provides a shaded guide to immediately distinguish whether a defect signal is within the weld or the HAZ section, where defect frequency is high.
%20program_introduction/images/slide_21_img_10.png)
%20program_introduction/images/slide_21_img_3.png)
Offset & Skew Settings
Synchronizes the physical position of the probe with the software coordinate system.
- Probe Offset: Enter the distance the probe is away from the weld centerline.
- Index Offset: Offset distance perpendicular to the weld line.
- Scan Offset: Distance correction in the scan direction.
- Skew Angle: Select the direction the probe is facing from 0°, 90°, 180°, or 270°. The software’s data acquisition axis is automatically synchronized based on the set angle.
5.5.4 Probe & Wedge Settings
Synchronizes hardware specifications for generating and transmitting ultrasound to the test object. These parameters must match the actual transducer to ensure accurate beam calculation and reliability of acquired data.
Basic Concepts:
- Probe (Transducer): A core sensor that converts electrical energy into ultrasonic vibrations for transmission into a specimen and receives reflected signals. Acts as the system’s ‘eye’.
- Wedge: A medium placed between the transducer and the test object. Assists in refracting beams to enter at specific angles and prevents transducer wear from direct contact with the specimen.
Probe Settings
Defines unique transducer specifications and range of transmitting/receiving elements.
- Probe Type: Select the appropriate type according to the sensor’s element array method.
- PA Linear: The most common Phased Array transducer with elements arranged in a single line (1D).
- PA Dual (Pitch-Catch): A type where transmitting and receiving element arrays are independent. Reduces dead zones near the surface and provides high signal quality when inspecting materials with high attenuation or thick base metals.
- Single / Dual UT: Single element or split transmit/receive conventional ultrasonic transducers.
- Probe Wizard: A function to automatically load transducer specifications by selecting model names from a built-in database.
- Automatic Entry: Pitch, Frequency, total number of Elements, etc., are automatically filled to prevent input errors.
- Tx/Rx Elements: Specifies the range of elements to be actually activated within the array.
- First Element: Defines which element of the device port each probe starts from in multi-probe configurations to prevent data interference.
%20program_introduction/images/4.png)
Wedge Settings
Controls the status of the wedge attached to the bottom of the transducer to physically adjust the angle of incidence.
- Why Use a Wedge?: Ultrasound naturally travels only vertically. When beams must be sent at an angle, as in weld inspection, a wedge machined at a specific angle is used to refract the beam. It also improves coupling with the test object to reduce signal loss.
- Wedge On/Off: Determines whether to include travel time delay within the wedge in the calculation engine.
- Wedge Reverse: Used when the probe is physically mounted in a direction 180 degrees opposite to the wedge.
- Function: Reverses acquisition logic and visual guides with a single button, allowing correct data acquisition without hardware remounting.
- Wedge Parameters: For special wedges not in the database, optimize by directly inputting the following physical values:
- Wedge Angle: The physical angle between the bottom of the wedge and the surface the transducer sits on. This must be accurate to calculate the final refraction angle into the test object.
- Wedge Velocity: Speed of ultrasound in the wedge material. Refractive index varies with material sound velocity, so precise input is required.
- Primary Offset (X-Offset): Horizontal distance from the first element of the transducer to the front end (Toe) of the wedge. Core reference point for calculating defect distance from the transducer.
- Height at First Element (Z-Offset): Vertical height from the bottom of the wedge to the first element. Essential for calculating actual True Depth of defects.
%20program_introduction/images/6.png)
5.5.5 Gate Settings
This parameter group specifies a particular area for analysis among the numerous ultrasonic signals appearing on screen. The gate serves as the inspector’s ‘eye’—a virtual fence—where only signals entering this area are judged as defects or recorded as quantitative data such as depth and amplitude.
Why are Gates Needed?: Ultrasonic signals contain unnecessary information like surface noise or structural reflections. By specifying an observation section with a gate, noise is excluded and precise depth and size of actual defects can be extracted to perform automatic measurement and alarm functions.
Gate Selection
- Gate A / B: Main gates for defect detection and measurement. Two gates can be used to compare and analyze distance or amplitude differences between defects.
- Gate I (Interface): A special gate for tracking surface (Interface) echoes of specimens. It ensures stable inspection by synchronizing (Sync) the starting points of other gates to the surface signal in environments where surfaces are rough or variable.
Control Parameters
- Gate Start / Range: Sets the start point and width of the observation area. Supports 0.1mm precision control to ensure even minute defect sections are not missed.
- Gate Threshold: Sensitivity baseline for determining from what height a signal is accepted as valid data.
- Detection Mode: Determines which point of the signal within the gate is adopted as the ‘measurement point’.
- Peak: Measures the ‘summit point’ with the highest amplitude among signals entered in the gate. Favorable for determining maximum defect size.
- Edge: Takes the ‘first contact (intersection) point’ where the signal meets the gate threshold as the measurement point. Favorable for precisely capturing where a defect begins.
Measurement Mode
- Sound Path (Distance-based): Displays the actual travel distance from the transducer to the defect. Used to track the physical path the beam travels; the gate line appears as an Arc centered on the transducer on the S-Scan.
- True Depth (Depth-based): Calculates vertical depth from the specimen surface. Most commonly used in practice to immediately grasp defect position; the gate line appears as a Horizontal line parallel to the surface on the S-Scan.
%20program_introduction/images/slide_28_img_5.png)
%20program_introduction/images/slide_28_img_13.png)
5.5.6 Encoder Settings
This parameter group measures the physical distance traveled by the transducer and assigns accurate position coordinates to ultrasonic data. Signals acquired through encoder settings are no longer just waveforms but can be visually mapped to identify which point in the specimen the defect occurred.
Why is an Encoder Needed?: Moving a transducer manually without an encoder makes it impossible to accurately record signal positions. Using an encoder synchronizes transducer position and ultrasonic signals 1:1, allowing for the generation of precision images like C-Scan or B-Scan and measuring actual defect size.
Scanner Type
Select an acquisition method suitable for inspection purpose and hardware environment.
%20program_introduction/images/slide_30_img_3.png)
- One Line: Acquisition method using only a single axis (Scan Axis) by moving the transducer in a straight line. Most commonly used for general inspections like finding defects along a weld’s length.
- Raster: Utilizes both Main Scan and Index axes to scan a specific area in a zigzag pattern. Essential for 평면 images confirming defect distribution over wide areas, such as in corrosion mapping.
- Time (Time-based): Used in environments without an encoder device. Acquires data at regular time intervals at a constant speed.
Key Parameters
- Scan Start / Stop: Defines actual physical intervals for inspection (e.g., starts at 0mm and automatically ends acquisition at 500mm).
- Scan Step: Sampling interval determining data density. Setting to 1mm saves one set of data every time the encoder moves 1mm. Smaller values yield high-resolution images but increase data size.
- Scan Resolution: Number of electrical pulses the encoder hardware sends to the device per 1mm of travel. Correct input of encoder specification (e.g., 200 pulses/mm) is required for physical distance to match on-screen numbers.
- Scan Position (Current Position/Zero): Displays real-time encoder position; check this when pressing ‘Zero’ at a specific point to set a reference.
- Reverse: If encoder rotation direction and software distance increase are opposite, software-wise reversal is possible without physical reinstallation.
- Axis Swap: Used to swap horizontal (Scan) and vertical (Index) axis data display according to scanner mounting direction.
Color Axis Mapping
DSVision assigns unique colors to each data axis for intuitive analysis, synchronized with numerical colors in the status bar for immediate data identification.
%20program_introduction/images/slide_35_img_10.png)
- Scan (Blue): Position information in the transducer’s main travel direction.
- Index (Green): Position information for spacing between scan lines.
- Ultrasound (Purple/Pink): Actual travel path of ultrasound and depth information within metal.
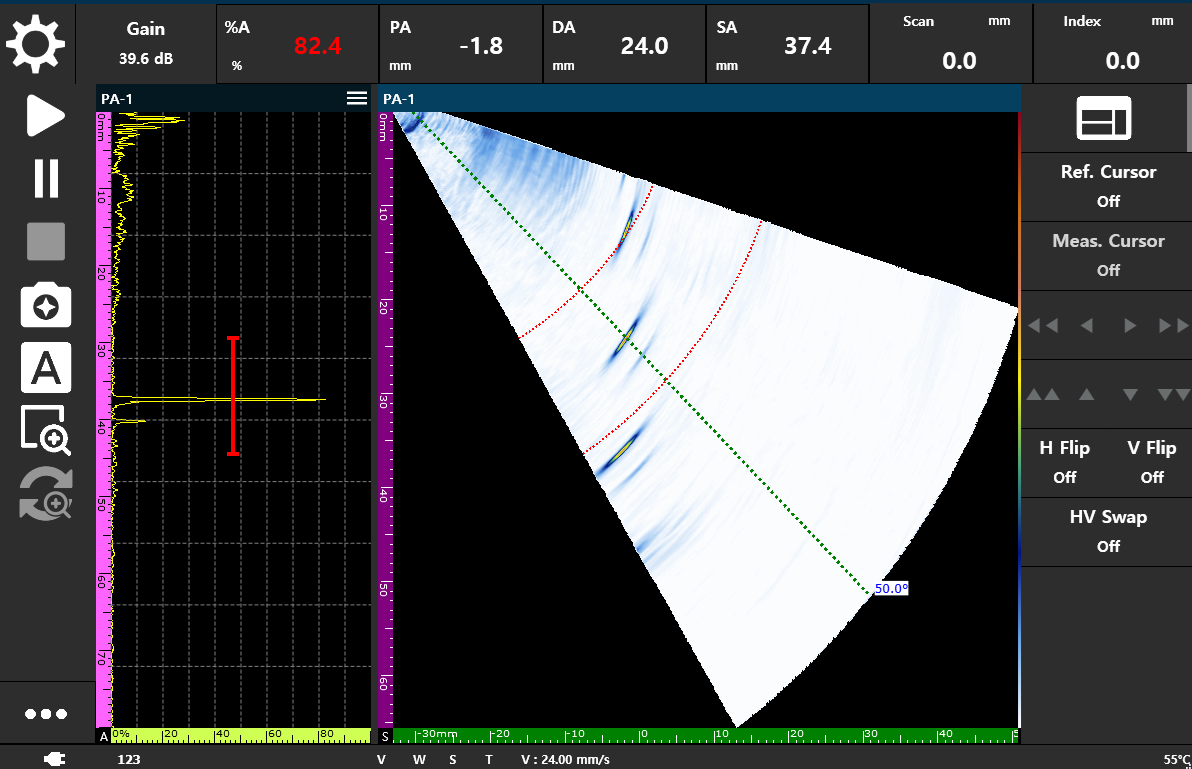
5.5.7 Display Settings
A group of tools for optimizing the visual configuration of analysis screens and precisely measuring defect size and position. You can adjust screens to match inspection environments and extract quantitative analysis data using digital cursors.
Why are Viewing Settings Important?: In actual field inspections, probe mounting direction or inspector position may vary. Matching the screen with actual scan direction through viewing settings prevents interpretation errors, and precise cursor operation is the most important step in determining inspection report reliability.
View Optimization
- H / V Flip: If probe mounting direction is reversed, immediately flips the screen image horizontally (H) or vertically (V) without hardware reinstallation. This perfectly aligns data flow on screen with actual scan direction.
- HV Swap: Swaps horizontal and vertical axis data. Useful for more intuitively analyzing certain cross-sectional geometries.
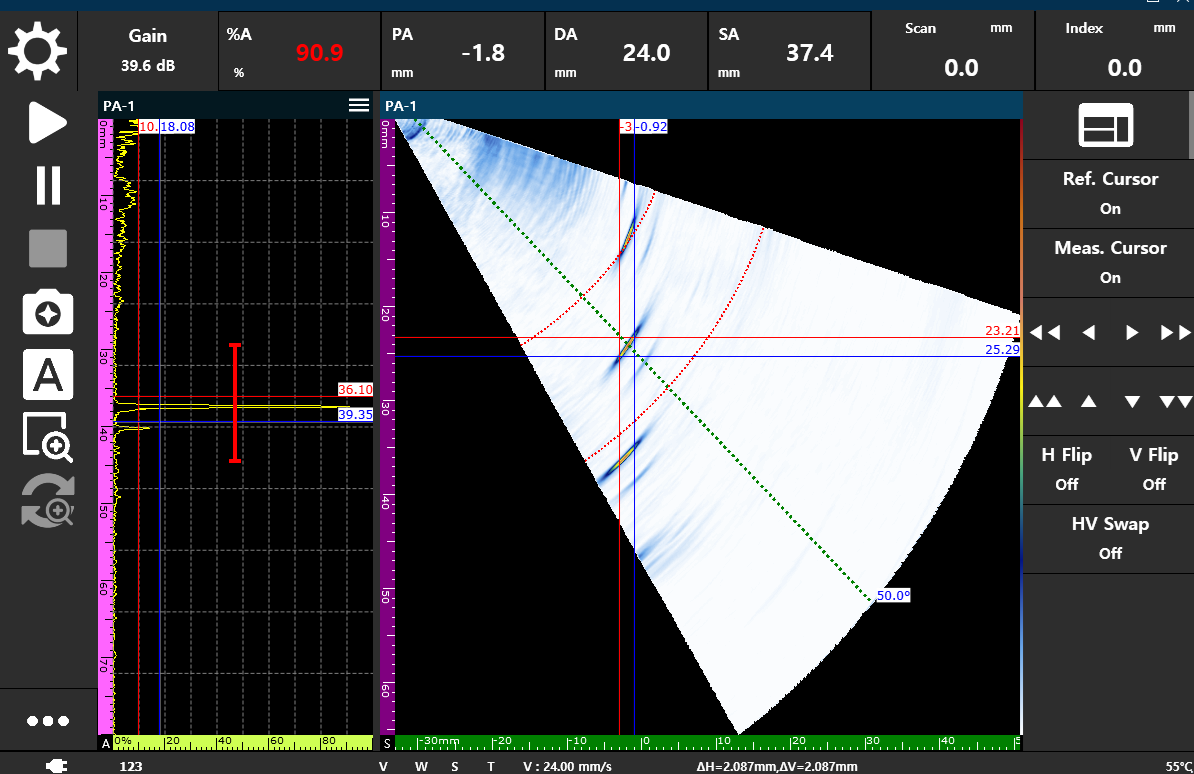
Cursor Control
DSVision’s cursors are core tools for quantifying defect length, depth, and amplitude. Precision measurement is possible without complex operation through a dedicated controller.
%20program_introduction/images/slide_34_img_11.png)
- Reference / Measurement Cursor: Activate Reference (Ref) and Measurement (Meas) cursors respectively to calculate distance or amplitude differences between two points.
- 8-way Controller Operation:
- Fast Movement (
<<,>>,^^,vv): Used for Coarse adjustment to quickly move cursors across wide ranges toward analysis points. - Fine Movement (
<,>,^,v): Used for Fine adjustment to precisely match cursors to maximum peak points or boundary areas.
- Fast Movement (
5.5.8 Channel Management
A function to divide hardware resources to build and manage multiple independent inspection environments. Each channel can be quickly switched and operated via the top tab UI, designed for efficient operation of complex multi-probe inspection scenarios.
Core Functions
- Add: Creates a new independent channel based on the currently selected configuration (Config).
- Copy: Duplicates all parameters of an existing channel (Gain, Gate, Calibration, etc.) to create a new one. Reduces preparation time in multi-probe environments requiring similar settings.
- Rename: Assigns unique names to each channel based on inspection area or purpose to increase identification.
- Remove: Deletes unnecessary channels from the active group to organize the workspace.
 program_introduction/images/slide_39_img_10.png)
Channel Addition and Management Menu
Hardware Resource Mapping
To effectively configure multi-channels, it is essential to define which physical port (element) of the device each software channel corresponds to through the First Element setting.
- Working Principle: Specifies the starting element number for each channel on the device’s total element board (e.g., 128 elements).
- Allocation Example: When configuring 4 PA channels with 32 elements each on a 128-element board, specify First Element for each channel sequentially as 1 / 33 / 65 / 97 to allow independent data acquisition without signal interference.
5.5.9 Screen Layout
Dynamically adjusts analysis screen configuration through various viewing templates. Screen combinations such as A, B, S, and C-Scan can be selected based on inspection situations, and data from each channel can be efficiently arranged and monitored during multi-channel operation.
 program_introduction/images/slide_41_img_3.png)
Layout Template Selection Screen
- Layout Templates: Provides a list of layouts optimized according to the active channel’s configuration. Users can select and immediately apply templates ranging from single to multi-split screens.
- Multi-Channel Layout Management: Adding or duplicating channels automatically allocates their data to the layout grid. Allows simultaneous visualization of data from multiple groups, and displays the A-Scan associated with each channel group as default to reduce screen complexity.
 program_introduction/images/slide_41_img_12.png)
Example of Multi-Channel Layout Application
5.5.10 Calibration Wizard
Calibration is the core process of matching all digital signals acquired by the DSVision system with actual physical values. Since defect size and position cannot be trusted without accurate calibration, it must be performed according to verified procedures. Upon successful completion of each step, the status indicators (V, W, S, T) at the bottom of the screen activate in Red to ensure data integrity of the system.
Velocity Calibration
A procedure to accurately synchronize the unique sound velocity of each inspection material (carbon steel, aluminum, etc.) with the system. Accuracy at this stage ensures that all distance and depth values on A-Scan and S-Scan match physical dimensions of the specimen.
- Principle and Details: Uses the time difference between two different reflection signals (e.g., 1st backwall Ref A and 2nd backwall Ref B) from a reference block of known thickness. The system analyzes arrival time between received echoes in nanoseconds (ns) to back-calculate internal sound velocity in m/s.
- Operation Procedure: Input actual positions of two points on the specimen, precisely align cursors with corresponding echo signals on screen, and perform Calibrate.
- Result: Calculated sound velocity is automatically applied to the system and the V indicator at the bottom lights up.
 program_introduction/images/slide_43_img_10.png)
Velocity Calibration: Automatic Material Sound Velocity Calculation via High-Resolution Time Analysis
Wedge Delay Calibration
Compensates for time differences between ultrasound emitted from each element of a Phased Array transducer traveling through the wedge material to reach the specimen surface. Ensures all beam vectors have the same ‘Zero-point’ at the specimen surface, eliminating geometric error in defect position interpretation.
- Visual Calibration (Envelope): Operating the probe while emitting beams forms an Envelope (Red line) of real-time signals. By perfectly aligning this envelope within the Green Tolerance Guidelines provided by the system, you can immediately visually verify that time delays across all angles have been uniformly corrected.
- Result: Clicking Finish applies delay values per element and lights up the W indicator. Signals across all angles are now aligned with actual physical depth.
 program_introduction/images/9.png)
Wedge Delay Calibration: Visual Alignment Process to Match Zero-points of All Beam Angles
Sensitivity Calibration
Compensates for minute sensitivity differences due to element-specific characteristics or wedge coupling status. Ensures all beam angles show uniform amplitude response to the same sized defect, securing inspection objectivity through flattening.
- Operation and Principle: Calculates correction values so that identical target amplitudes (e.g., 80% FSH) are acquired across all angles based on a specific target (e.g., SDH). The user moves the probe so that beams at all angles obtain maximum energy from the reference reflector, and the system automatically optimizes Gain for each vector accordingly.
- Result: The S indicator lights up, and defect size can be evaluated with consistent sensitivity regardless of detection angle.
 program_introduction/images/10.png)
Sensitivity Calibration: Sensitivity Flattening to Secure Uniform Signal Response Performance Across All Angles
TCG (Time Corrected Gain) Calibration
Compensates for the physical phenomenon where ultrasonic energy attenuates as it travels deeper into material. Ensures that defects of the same size are displayed with consistent signal height on screen regardless of depth, maximizing interpretation efficiency and accuracy.
- Precision Design: Acquires signals from reference reflectors at different depths to create TCG Points (Steps). Users can finely adjust position and gain for each point using arrow icons (◀ / ▶) and immediately remove (X) unnecessary points.
- Advanced Setting: Specifically, sector ranges can be modified to apply TCG only to specific angle ranges (Angle Start / Stop), allowing for flexible response in complex inspection environments.
- Result: The T indicator lights up, and sensitivity differences due to depth are perfectly compensated.
 program_introduction/images/slide_46_img_17.png)
TCG Calibration: Digital Gain Control Curve Design to Compensate for Attenuation by Depth and Angle
Encoder Calibration
A procedure to match physical transducer travel distance with software coordinates 1:1. Accuracy here allows for precise measurement of actual defect size and position in C-Scan or B-Scan images.
- Intelligent Wizard: Move the encoder physically by a fixed distance (e.g., 100mm) and input the actual travel value; the system automatically derives Encoder Resolution (Pulse/mm).
- Procedure: Axis Selection (Scan/Index) → Record Start Position → Physical Movement → Record End Position → Input and Calculate Actual Distance → Apply (OK).
- Result: Digital coordinates and actual physical scan positions are perfectly synchronized.
 program_introduction/images/slide_47_img_3.png)
Encoder Calibration: Real-time Synchronization of Physical Travel Distance and Digital Pulses
5.6 Bottom Toolbar explanations
The toolbar located at the bottom of the program is an area for checking major information such as current equipment calibration status and battery level at a glance.
5.6.1 Calibration Status (V, W, S, T) Indicators
Displays in real-time whether major calibration items required for inspection have been applied.
- Items: V (Velocity), W (Wedge Delay), S (Sensitivity), T (TCG)
- Status Display: Completed and active items are displayed in Red, while incomplete items are shown in White.
5.6.2 Battery & Charging Status
Displays icons for current battery level (%) and power connection (charging) status. Constant monitoring of power status during field inspection prevents sudden device shutdown.
5.6.3 Setup name & Velocity & Temperature
- Setup name: Displays the name of the currently active configuration file (.set).
- Velocity: Indicates the sound velocity (m/s) currently applied to the system.
- Temperature: Displays current internal temperature of the device to monitor operating environment.

Status Monitoring via Bottom Toolbar (V, W, S, T Indicators and System Info)
5.7 Advanced Measurement Logic
DSVision provides precise gate control and measurement logic to convert acquired ultrasonic signals into quantitative data. Inspectors can specify particular analysis areas through gate settings and derive signal depth and amplitude based on various criteria (Echo Type).
5.7.1 Gate Principles
Gates are tools to specify the ‘Region of Interest’ for actual analysis among many signals appearing on screen. DSVision provides up to three independent gates (A, B, I) and records or judges only signals entering these gates as defects or quantitative data.
5.7.2 Echo Type & Visualization
Supports two measurement modes based on reference points for calculating signal positions in Angled Beam environments. This plays a key role in intuitively grasping physical defect locations.
- Sound Path: Displays total diagonal distance ultrasound travels from transducer to defect. Gate line appears as an Arc centered on the transducer on the S-Scan.
- True Depth: Calculates and displays actual vertical depth from specimen surface to defect. Gate line appears as a Horizontal line parallel to the surface on the S-Scan.
5.7.3 Gate Synchronization & Detection Logic
DSVision provides a Gate Synchronization function to maintain stable defect detection even in field conditions where surfaces are irregular or highly variable.
- Gate I (Interface Gate) & Sync:
- Interface Gate (I): A special gate that tracks specimen surface (Interface) echoes in real-time.
- Synchronization (Sync): Sets the surface signal captured by Gate I as the temporal reference point (T=0). This synchronizes Gates A and B to always maintain a constant depth from the surface to monitor for defects, even if specimen surface height varies.
- Detection Mode:
- Peak: Measures the point with the highest amplitude within the gate area. Favorable for determining maximum defect size.
- Edge: Measures where the signal first meets the gate threshold. Favorable for precisely capturing where a defect begins.
%20program_introduction/images/slide_27_img_3.png)
5.7.4 Practical Defect Evaluation Workflow
Gates are active tools that ‘capture’ actual defects and sound ‘alarms’, beyond just specifying areas.
- Threshold Setting: Set gate line height higher than background noise but lower than expected minimum defect signals.
- Signal Triggering: The moment an ultrasonic echo exceeds the gate line, the system recognizes it as a ‘valid signal’. At this point, gate color changes on screen or an audible alarm (GateLine Horn) is generated to immediately notify the inspector.
- Maximum Peak Tracking: When an inspector moves the probe slightly to find the point (Peak) where signal height is highest, the system fixedly outputs data for that point on the top info panel in real-time.
5.7.5 Interpreting Measurement Data (P, D, S)
Signals captured in the gate are converted to actual physical coordinates within the test object via top panel numerical values (P, D, S). Inspectors can map precise defect locations through this data.
- Amplitude (%): Signal intensity. Serves as a measure to evaluate defect size or reflectivity compared to reference signals (e.g., 80% FSH).
- Depth (D - Vertical Depth): Vertical depth from specimen surface to defect. Values smaller than half of
Thicknesssetting mean the defect is near the surface; larger values mean it is near the bottom. - Primary (P - Horizontal Distance): Indicates how far the defect is horizontally from the probe’s entry point.
- Sound Path (S - Beam Distance): Actual diagonal distance ultrasound travels.
Practical Interpretation Example:
If a defect signal is seen on the S-Scan and D: 15.2mm / P: 25.0mm is displayed on the top panel, it means “A defect exists at a depth of 15.2mm at a point 25mm away from the probe.” The inspector can apply these coordinates to a Weld Profile to immediately judge whether the defect is within the weld or spans the HAZ.
5.7.6 Defect Judgment Criteria
Final judgment on pass/fail of defects is made based on acquired data.
- Echo Height Assessment: Check if signal amplitude (%) within the gate exceeds pre-set evaluation levels (e.g., above DAC curve or 50% of reference sensitivity).
- Location Analysis: Analyze whether defect coordinates (P, D) are located in critical weld zones (e.g., Root or Fusion Line). Defects in certain zones may be evaluated as high-risk even if small.
- Data Recording: Once judgment is complete, take a ‘Screen Shot’ or save data at that location to generate a final inspection report containing defect position and size.
5.8 Cursor Analysis & Sizing
If a Gate acts as an ‘alarm’ notifying presence of a defect in a specific area, a Cursor is a tool for ‘measuring’ actual physical size and precise position of the found defect. DSVision provides a precision analysis environment using two cursors to derive defect length and height.
5.8.1 The Role of Cursors
Cursors extract coordinate and amplitude values of any point on the scan data.
- Quantitative Data: Beyond simple “defect presence” judgment, used to prove “what is the defect length in mm?” with numerical values.
- Precision Position Correction: Allows manual designation and analysis of boundary areas where defects start and end, as well as peak points captured by gates.
5.8.2 Ref / Measurement System
DSVision’s cursors work in pairs: Reference (Ref) and Measurement.
- Ref Cursor: Fixed at the starting point or peak point of the area to be analyzed, acting as the measurement Zero point.
- Measurement Cursor: Acts as the end point moving from the reference point to calculate distance difference.
- Cursor Control: Cursors can be precisely moved up, down, left, and right via the 8-way controller in the right configuration menu.
5.8.3 Interpreting ΔH and ΔV
When cursors are active, the distance difference between them is displayed as Delta (Δ) values in the status bar at the bottom of the screen.
- ΔH (Horizontal Delta): Horizontal distance difference between two cursors. Primarily used to measure defect Length.
- ΔV (Vertical Delta): Vertical distance (depth) difference between two cursors. Primarily used to measure defect Height.
5.8.4 Defect Sizing (6dB Drop Method)
The sizing procedure using the 6dB Drop (50% Attenuation method), most widely used in the field, is as follows:
- Peak Search: Move the probe to find the point where the defect signal is highest.
- Reference Setting: Place the Ref Cursor at that peak point.
- Boundary Search: Move the Measurement Cursor left/right or up/down until the signal amplitude drops to half (6dB down) of the peak.
- Size Determination: The ΔH or ΔV value displayed on the status bar at this point becomes the actual physical size (length or height) of the defect.
6. Specialized Inspection Modes
- Description of advanced functions and modes optimized for specific inspection purposes.